wradlib Documentation - Bitbucket
wradlib Documentation - Bitbucket
wradlib Documentation - Bitbucket
You also want an ePaper? Increase the reach of your titles
YUMPU automatically turns print PDFs into web optimized ePapers that Google loves.
<strong>wradlib</strong> <strong>Documentation</strong>, Release 0.1.1<br />
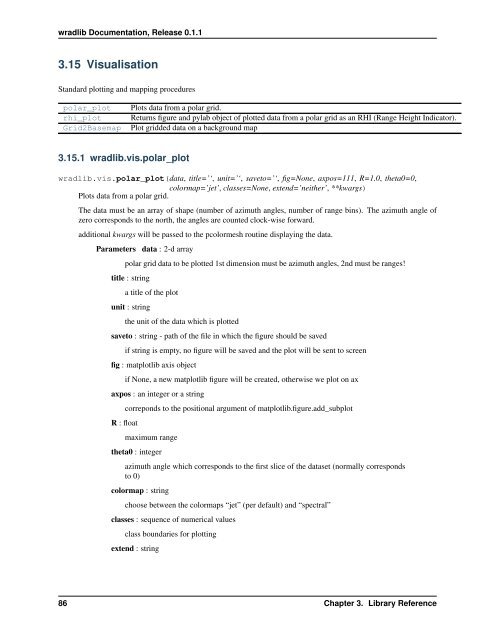
3.15 Visualisation<br />
Standard plotting and mapping procedures<br />
polar_plot<br />
rhi_plot<br />
Grid2Basemap<br />
Plots data from a polar grid.<br />
Returns figure and pylab object of plotted data from a polar grid as an RHI (Range Height Indicator).<br />
Plot gridded data on a background map<br />
3.15.1 <strong>wradlib</strong>.vis.polar_plot<br />
<strong>wradlib</strong>.vis.polar_plot(data, title=’‘, unit=’‘, saveto=’‘, fig=None, axpos=111, R=1.0, theta0=0,<br />
colormap=’jet’, classes=None, extend=’neither’, **kwargs)<br />
Plots data from a polar grid.<br />
The data must be an array of shape (number of azimuth angles, number of range bins). The azimuth angle of<br />
zero corresponds to the north, the angles are counted clock-wise forward.<br />
additional kwargs will be passed to the pcolormesh routine displaying the data.<br />
Parameters data : 2-d array<br />
polar grid data to be plotted 1st dimension must be azimuth angles, 2nd must be ranges!<br />
title : string<br />
a title of the plot<br />
unit : string<br />
the unit of the data which is plotted<br />
saveto : string - path of the file in which the figure should be saved<br />
if string is empty, no figure will be saved and the plot will be sent to screen<br />
fig : matplotlib axis object<br />
if None, a new matplotlib figure will be created, otherwise we plot on ax<br />
axpos : an integer or a string<br />
R : float<br />
correponds to the positional argument of matplotlib.figure.add_subplot<br />
maximum range<br />
theta0 : integer<br />
azimuth angle which corresponds to the first slice of the dataset (normally corresponds<br />
to 0)<br />
colormap : string<br />
choose between the colormaps “jet” (per default) and “spectral”<br />
classes : sequence of numerical values<br />
class boundaries for plotting<br />
extend : string<br />
86 Chapter 3. Library Reference


