wradlib Documentation - Bitbucket
wradlib Documentation - Bitbucket
wradlib Documentation - Bitbucket

You also want an ePaper? Increase the reach of your titles
YUMPU automatically turns print PDFs into web optimized ePapers that Google loves.
<strong>wradlib</strong> <strong>Documentation</strong>, Release 0.1.1<br />
All raw data is provided by DWD<br />
2.4 Converting reflectivities<br />
Reflectivity (Z) and precipitation rate (R) can be related in form of a power law R=a*Z**b. The parameters a and b<br />
depend on the type of precipitation (i.e. drop size distribution and water temperature).<br />
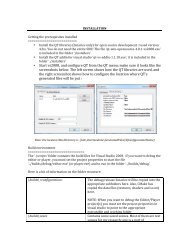
Because the ZR-relationship is based on reflectivities in Z and the encoded radar data is given in dBZ we have to take<br />
the antilogarithm of the dBZ-values after reading the DX-data (Read and plot raw DWD radar data):<br />
import <strong>wradlib</strong> as wrl<br />
# set the location of your data<br />
datadir = ’D:/THIS/IS/MY/DATA/DIRECTORY/’<br />
data_dBZ = wrl.io.readDX(datadir + ’raa00-dx_10908-200608180225-fbg---bin’)[0]<br />
data_Z = wrl.trafo.idecibel(data_dBZ)<br />
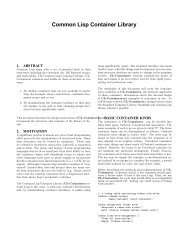
After taking the antilogarithm the scale of low precipitation rates appears distinctly more squeezed:<br />
wrl.vis.polar_plot(data_dBZ, title = ’Reflectivity: Radarscan Feldberg 18-08-2006 02:25’,<br />
unit = ’dBZ’, colormap = ’spectral’)<br />
wrl.vis.polar_plot(data_Z, title = ’Reflectivity: Radarscan Feldberg 18-08-2006 02:25’,<br />
unit = ’Z’, colormap = ’spectral’)<br />
22 Chapter 2. Tutorials