wradlib Documentation - Bitbucket
wradlib Documentation - Bitbucket
wradlib Documentation - Bitbucket

You also want an ePaper? Increase the reach of your titles
YUMPU automatically turns print PDFs into web optimized ePapers that Google loves.
<strong>wradlib</strong> <strong>Documentation</strong>, Release 0.1.1<br />
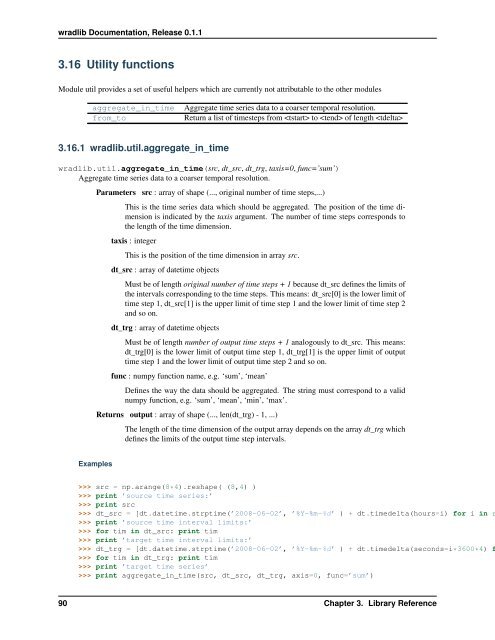
3.16 Utility functions<br />
Module util provides a set of useful helpers which are currently not attributable to the other modules<br />
aggregate_in_time<br />
from_to<br />
Aggregate time series data to a coarser temporal resolution.<br />
Return a list of timesteps from to of length <br />
3.16.1 <strong>wradlib</strong>.util.aggregate_in_time<br />
<strong>wradlib</strong>.util.aggregate_in_time(src, dt_src, dt_trg, taxis=0, func=’sum’)<br />
Aggregate time series data to a coarser temporal resolution.<br />
Parameters src : array of shape (..., original number of time steps,...)<br />
This is the time series data which should be aggregated. The position of the time dimension<br />
is indicated by the taxis argument. The number of time steps corresponds to<br />
the length of the time dimension.<br />
taxis : integer<br />
This is the position of the time dimension in array src.<br />
dt_src : array of datetime objects<br />
Must be of length original number of time steps + 1 because dt_src defines the limits of<br />
the intervals corresponding to the time steps. This means: dt_src[0] is the lower limit of<br />
time step 1, dt_src[1] is the upper limit of time step 1 and the lower limit of time step 2<br />
and so on.<br />
dt_trg : array of datetime objects<br />
Must be of length number of output time steps + 1 analogously to dt_src. This means:<br />
dt_trg[0] is the lower limit of output time step 1, dt_trg[1] is the upper limit of output<br />
time step 1 and the lower limit of output time step 2 and so on.<br />
func : numpy function name, e.g. ‘sum’, ‘mean’<br />
Defines the way the data should be aggregated. The string must correspond to a valid<br />
numpy function, e.g. ‘sum’, ‘mean’, ‘min’, ‘max’.<br />
Returns output : array of shape (..., len(dt_trg) - 1, ...)<br />
The length of the time dimension of the output array depends on the array dt_trg which<br />
defines the limits of the output time step intervals.<br />
Examples<br />
>>> src = np.arange(8*4).reshape( (8,4) )<br />
>>> print ’source time series:’<br />
>>> print src<br />
>>> dt_src = [dt.datetime.strptime(’2008-06-02’, ’%Y-%m-%d’ ) + dt.timedelta(hours=i) for i in r<br />
>>> print ’source time interval limits:’<br />
>>> for tim in dt_src: print tim<br />
>>> print ’target time interval limits:’<br />
>>> dt_trg = [dt.datetime.strptime(’2008-06-02’, ’%Y-%m-%d’ ) + dt.timedelta(seconds=i*3600*4) f<br />
>>> for tim in dt_trg: print tim<br />
>>> print ’target time series’<br />
>>> print aggregate_in_time(src, dt_src, dt_trg, axis=0, func=’sum’)<br />
90 Chapter 3. Library Reference