wradlib Documentation - Bitbucket
wradlib Documentation - Bitbucket
wradlib Documentation - Bitbucket

Create successful ePaper yourself
Turn your PDF publications into a flip-book with our unique Google optimized e-Paper software.
<strong>wradlib</strong> <strong>Documentation</strong>, Release 0.1.1<br />
All raw data is provided by DWD<br />
2.5 Integration of precipitation rates (Accumulation)<br />
2.5.1 Integrating precipitation rate of one radar scan over its corresponding time<br />
interval<br />
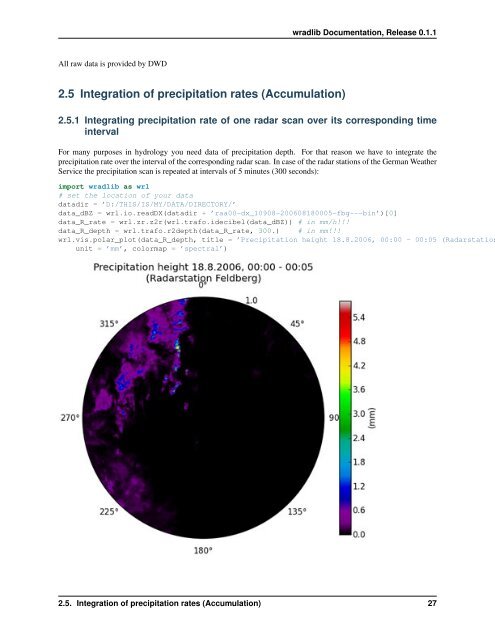
For many purposes in hydrology you need data of precipitation depth. For that reason we have to integrate the<br />
precipitation rate over the interval of the corresponding radar scan. In case of the radar stations of the German Weather<br />
Service the precipitation scan is repeated at intervals of 5 minutes (300 seconds):<br />
import <strong>wradlib</strong> as wrl<br />
# set the location of your data<br />
datadir = ’D:/THIS/IS/MY/DATA/DIRECTORY/’<br />
data_dBZ = wrl.io.readDX(datadir + ’raa00-dx_10908-200608180005-fbg---bin’)[0]<br />
data_R_rate = wrl.zr.z2r(wrl.trafo.idecibel(data_dBZ)) # in mm/h!!!<br />
data_R_depth = wrl.trafo.r2depth(data_R_rate, 300.) # in mm!!!<br />
wrl.vis.polar_plot(data_R_depth, title = ’Precipitation height 18.8.2006, 00:00 - 00:05 (Radarstation<br />
unit = ’mm’, colormap = ’spectral’)<br />
2.5. Integration of precipitation rates (Accumulation) 27