wradlib Documentation - Bitbucket
wradlib Documentation - Bitbucket
wradlib Documentation - Bitbucket
You also want an ePaper? Increase the reach of your titles
YUMPU automatically turns print PDFs into web optimized ePapers that Google loves.
<strong>wradlib</strong> <strong>Documentation</strong>, Release 0.1.1<br />
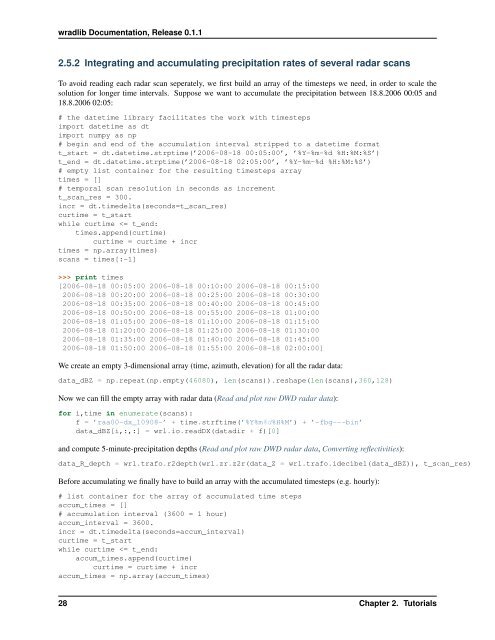
2.5.2 Integrating and accumulating precipitation rates of several radar scans<br />
To avoid reading each radar scan seperately, we first build an array of the timesteps we need, in order to scale the<br />
solution for longer time intervals. Suppose we want to accumulate the precipitation between 18.8.2006 00:05 and<br />
18.8.2006 02:05:<br />
# the datetime library facilitates the work with timesteps<br />
import datetime as dt<br />
import numpy as np<br />
# begin and end of the accumulation interval stripped to a datetime format<br />
t_start = dt.datetime.strptime(’2006-08-18 00:05:00’, ’%Y-%m-%d %H:%M:%S’)<br />
t_end = dt.datetime.strptime(’2006-08-18 02:05:00’, ’%Y-%m-%d %H:%M:%S’)<br />
# empty list container for the resulting timesteps array<br />
times = []<br />
# temporal scan resolution in seconds as increment<br />
t_scan_res = 300.<br />
incr = dt.timedelta(seconds=t_scan_res)<br />
curtime = t_start<br />
while curtime >> print times<br />
[2006-08-18 00:05:00 2006-08-18 00:10:00 2006-08-18 00:15:00<br />
2006-08-18 00:20:00 2006-08-18 00:25:00 2006-08-18 00:30:00<br />
2006-08-18 00:35:00 2006-08-18 00:40:00 2006-08-18 00:45:00<br />
2006-08-18 00:50:00 2006-08-18 00:55:00 2006-08-18 01:00:00<br />
2006-08-18 01:05:00 2006-08-18 01:10:00 2006-08-18 01:15:00<br />
2006-08-18 01:20:00 2006-08-18 01:25:00 2006-08-18 01:30:00<br />
2006-08-18 01:35:00 2006-08-18 01:40:00 2006-08-18 01:45:00<br />
2006-08-18 01:50:00 2006-08-18 01:55:00 2006-08-18 02:00:00]<br />
We create an empty 3-dimensional array (time, azimuth, elevation) for all the radar data:<br />
data_dBZ = np.repeat(np.empty(46080), len(scans)).reshape(len(scans),360,128)<br />
Now we can fill the empty array with radar data (Read and plot raw DWD radar data):<br />
for i,time in enumerate(scans):<br />
f = ’raa00-dx_10908-’ + time.strftime(’%Y%m%d%H%M’) + ’-fbg---bin’<br />
data_dBZ[i,:,:] = wrl.io.readDX(datadir + f)[0]<br />
and compute 5-minute-precipitation depths (Read and plot raw DWD radar data, Converting reflectivities):<br />
data_R_depth = wrl.trafo.r2depth(wrl.zr.z2r(data_Z = wrl.trafo.idecibel(data_dBZ)), t_scan_res)<br />
Before accumulating we finally have to build an array with the accumulated timesteps (e.g. hourly):<br />
# list container for the array of accumulated time steps<br />
accum_times = []<br />
# accumulation interval (3600 = 1 hour)<br />
accum_interval = 3600.<br />
incr = dt.timedelta(seconds=accum_interval)<br />
curtime = t_start<br />
while curtime


