wradlib Documentation - Bitbucket
wradlib Documentation - Bitbucket
wradlib Documentation - Bitbucket
Create successful ePaper yourself
Turn your PDF publications into a flip-book with our unique Google optimized e-Paper software.
<strong>wradlib</strong> <strong>Documentation</strong>, Release 0.1.1<br />
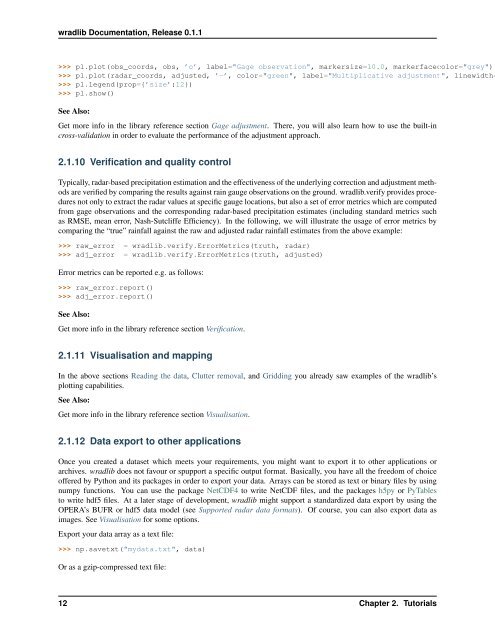
>>> pl.plot(obs_coords, obs, ’o’, label="Gage observation", markersize=10.0, markerfacecolor="grey")<br />
>>> pl.plot(radar_coords, adjusted, ’-’, color="green", label="Multiplicative adjustment", linewidth=<br />
>>> pl.legend(prop={’size’:12})<br />
>>> pl.show()<br />
See Also:<br />
Get more info in the library reference section Gage adjustment. There, you will also learn how to use the built-in<br />
cross-validation in order to evaluate the performance of the adjustment approach.<br />
2.1.10 Verification and quality control<br />
Typically, radar-based precipitation estimation and the effectiveness of the underlying correction and adjustment methods<br />
are verified by comparing the results against rain gauge observations on the ground. <strong>wradlib</strong>.verify provides procedures<br />
not only to extract the radar values at specific gauge locations, but also a set of error metrics which are computed<br />
from gage observations and the corresponding radar-based precipitation estimates (including standard metrics such<br />
as RMSE, mean error, Nash-Sutcliffe Efficiency). In the following, we will illustrate the usage of error metrics by<br />
comparing the “true” rainfall against the raw and adjusted radar rainfall estimates from the above example:<br />
>>> raw_error = <strong>wradlib</strong>.verify.ErrorMetrics(truth, radar)<br />
>>> adj_error = <strong>wradlib</strong>.verify.ErrorMetrics(truth, adjusted)<br />
Error metrics can be reported e.g. as follows:<br />
>>> raw_error.report()<br />
>>> adj_error.report()<br />
See Also:<br />
Get more info in the library reference section Verification.<br />
2.1.11 Visualisation and mapping<br />
In the above sections Reading the data, Clutter removal, and Gridding you already saw examples of the <strong>wradlib</strong>’s<br />
plotting capabilities.<br />
See Also:<br />
Get more info in the library reference section Visualisation.<br />
2.1.12 Data export to other applications<br />
Once you created a dataset which meets your requirements, you might want to export it to other applications or<br />
archives. <strong>wradlib</strong> does not favour or spupport a specific output format. Basically, you have all the freedom of choice<br />
offered by Python and its packages in order to export your data. Arrays can be stored as text or binary files by using<br />
numpy functions. You can use the package NetCDF4 to write NetCDF files, and the packages h5py or PyTables<br />
to write hdf5 files. At a later stage of development, <strong>wradlib</strong> might support a standardized data export by using the<br />
OPERA’s BUFR or hdf5 data model (see Supported radar data formats). Of course, you can also export data as<br />
images. See Visualisation for some options.<br />
Export your data array as a text file:<br />
>>> np.savetxt("mydata.txt", data)<br />
Or as a gzip-compressed text file:<br />
12 Chapter 2. Tutorials


