wradlib Documentation - Bitbucket
wradlib Documentation - Bitbucket
wradlib Documentation - Bitbucket

Create successful ePaper yourself
Turn your PDF publications into a flip-book with our unique Google optimized e-Paper software.
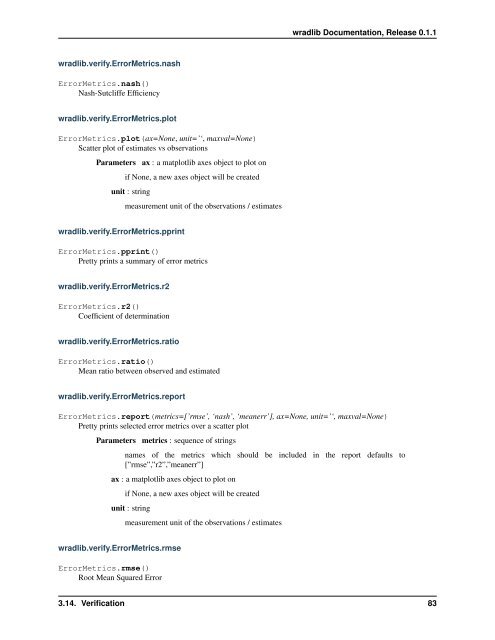
<strong>wradlib</strong> <strong>Documentation</strong>, Release 0.1.1<br />
<strong>wradlib</strong>.verify.ErrorMetrics.nash<br />
ErrorMetrics.nash()<br />
Nash-Sutcliffe Efficiency<br />
<strong>wradlib</strong>.verify.ErrorMetrics.plot<br />
ErrorMetrics.plot(ax=None, unit=’‘, maxval=None)<br />
Scatter plot of estimates vs observations<br />
Parameters ax : a matplotlib axes object to plot on<br />
if None, a new axes object will be created<br />
unit : string<br />
measurement unit of the observations / estimates<br />
<strong>wradlib</strong>.verify.ErrorMetrics.pprint<br />
ErrorMetrics.pprint()<br />
Pretty prints a summary of error metrics<br />
<strong>wradlib</strong>.verify.ErrorMetrics.r2<br />
ErrorMetrics.r2()<br />
Coefficient of determination<br />
<strong>wradlib</strong>.verify.ErrorMetrics.ratio<br />
ErrorMetrics.ratio()<br />
Mean ratio between observed and estimated<br />
<strong>wradlib</strong>.verify.ErrorMetrics.report<br />
ErrorMetrics.report(metrics=[’rmse’, ‘nash’, ‘meanerr’], ax=None, unit=’‘, maxval=None)<br />
Pretty prints selected error metrics over a scatter plot<br />
Parameters metrics : sequence of strings<br />
names of the metrics which should be included in the report defaults to<br />
[”rmse”,”r2”,”meanerr”]<br />
ax : a matplotlib axes object to plot on<br />
if None, a new axes object will be created<br />
unit : string<br />
measurement unit of the observations / estimates<br />
<strong>wradlib</strong>.verify.ErrorMetrics.rmse<br />
ErrorMetrics.rmse()<br />
Root Mean Squared Error<br />
3.14. Verification 83