wradlib Documentation - Bitbucket
wradlib Documentation - Bitbucket
wradlib Documentation - Bitbucket

Create successful ePaper yourself
Turn your PDF publications into a flip-book with our unique Google optimized e-Paper software.
<strong>wradlib</strong> <strong>Documentation</strong>, Release 0.1.1<br />
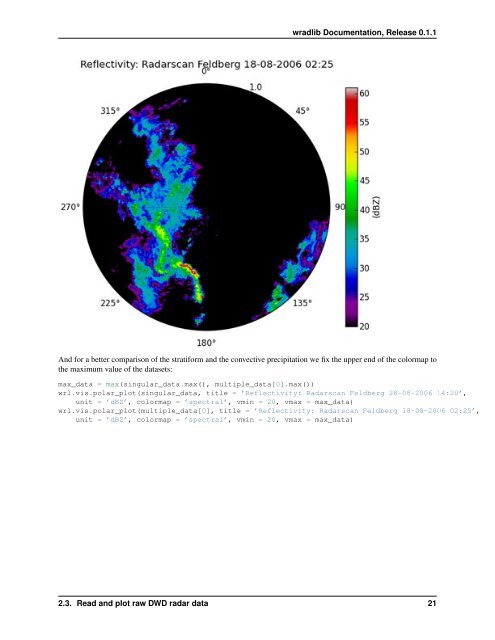
And for a better comparison of the stratiform and the convective precipitation we fix the upper end of the colormap to<br />
the maximum value of the datasets:<br />
max_data = max(singular_data.max(), multiple_data[0].max())<br />
wrl.vis.polar_plot(singular_data, title = ’Reflectivity: Radarscan Feldberg 28-08-2006 14:20’,<br />
unit = ’dBZ’, colormap = ’spectral’, vmin = 20, vmax = max_data)<br />
wrl.vis.polar_plot(multiple_data[0], title = ’Reflectivity: Radarscan Feldberg 18-08-2006 02:25’,<br />
unit = ’dBZ’, colormap = ’spectral’, vmin = 20, vmax = max_data)<br />
2.3. Read and plot raw DWD radar data 21