View - DSpace UniPR
View - DSpace UniPR
View - DSpace UniPR

You also want an ePaper? Increase the reach of your titles
YUMPU automatically turns print PDFs into web optimized ePapers that Google loves.
Chapter 5<br />
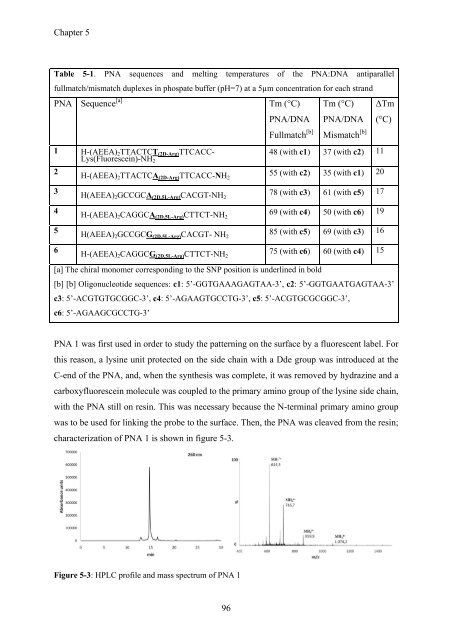
Table 5-1. PNA sequences and melting temperatures of the PNA:DNA antiparallel<br />
fullmatch/mismatch duplexes in phospate buffer (pH=7) at a 5µm concentration for each strand<br />
PNA Sequence [a]<br />
Tm (°C)<br />
Tm (°C)<br />
ΔTm<br />
PNA/DNA<br />
PNA/DNA<br />
(°C)<br />
Fullmatch [b]<br />
Mismatch [b]<br />
1 H-(AEEA) 2 TTACTCT (2D-Arg) TTCACC-<br />
Lys(Fluorescein)-NH 2<br />
2<br />
48 (with c1) 37 (with c2) 11<br />
H-(AEEA) 2 TTACTCA (2D-Arg) TTCACC-NH 2<br />
55 (with c2) 35 (with c1) 20<br />
3<br />
4<br />
5<br />
6<br />
H(AEEA) 2 GCCGCA (2D,5L-Arg) CACGT-NH 2<br />
78 (with c3) 61 (with c5) 17<br />
H-(AEEA) 2 CAGGCA (2D,5L-Arg) CTTCT-NH 2<br />
69 (with c4) 50 (with c6) 19<br />
H(AEEA) 2 GCCGCG (2D,5L-Arg) CACGT- NH 2<br />
85 (with c5) 69 (with c3) 16<br />
H-(AEEA) 2 CAGGCG (2D,5L-Arg) CTTCT-NH 2<br />
75 (with c6) 60 (with c4) 15<br />
[a] The chiral monomer corresponding to the SNP position is underlined in bold<br />
[b] [b] Oligonucleotide sequences: c1: 5’-GGTGAAAGAGTAA-3’, c2: 5’-GGTGAATGAGTAA-3’<br />
c3: 5’-ACGTGTGCGGC-3’, c4: 5’-AGAAGTGCCTG-3’, c5: 5’-ACGTGCGCGGC-3’,<br />
c6: 5’-AGAAGCGCCTG-3’<br />
PNA 1 was first used in order to study the patterning on the surface by a fluorescent label. For<br />
this reason, a lysine unit protected on the side chain with a Dde group was introduced at the<br />
C-end of the PNA, and, when the synthesis was complete, it was removed by hydrazine and a<br />
carboxyfluorescein molecule was coupled to the primary amino group of the lysine side chain,<br />
with the PNA still on resin. This was necessary because the N-terminal primary amino group<br />
was to be used for linking the probe to the surface. Then, the PNA was cleaved from the resin;<br />
characterization of PNA 1 is shown in figure 5-3.<br />
Figure 5-3: HPLC profile and mass spectrum of PNA 1<br />
96