View - DSpace UniPR
View - DSpace UniPR
View - DSpace UniPR

Create successful ePaper yourself
Turn your PDF publications into a flip-book with our unique Google optimized e-Paper software.
PNA Microcontact Printing<br />
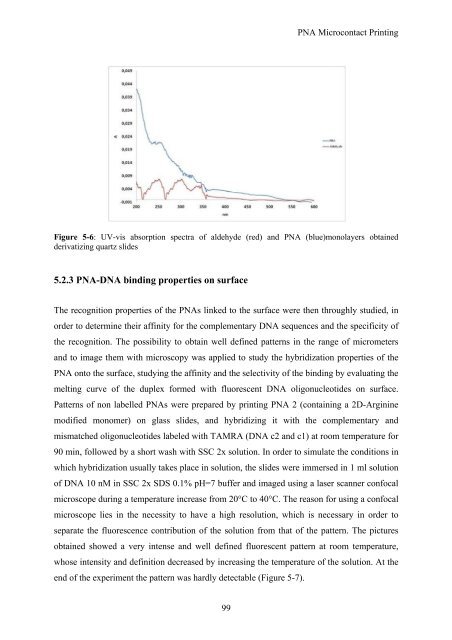
Figure 5-6: UV-vis absorption spectra of aldehyde (red) and PNA (blue)monolayers obtained<br />
derivatizing quartz slides<br />
5.2.3 PNA-DNA binding properties on surface<br />
The recognition properties of the PNAs linked to the surface were then throughly studied, in<br />
order to determine their affinity for the complementary DNA sequences and the specificity of<br />
the recognition. The possibility to obtain well defined patterns in the range of micrometers<br />
and to image them with microscopy was applied to study the hybridization properties of the<br />
PNA onto the surface, studying the affinity and the selectivity of the binding by evaluating the<br />
melting curve of the duplex formed with fluorescent DNA oligonucleotides on surface.<br />
Patterns of non labelled PNAs were prepared by printing PNA 2 (containing a 2D-Arginine<br />
modified monomer) on glass slides, and hybridizing it with the complementary and<br />
mismatched oligonucleotides labeled with TAMRA (DNA c2 and c1) at room temperature for<br />
90 min, followed by a short wash with SSC 2x solution. In order to simulate the conditions in<br />
which hybridization usually takes place in solution, the slides were immersed in 1 ml solution<br />
of DNA 10 nM in SSC 2x SDS 0.1% pH=7 buffer and imaged using a laser scanner confocal<br />
microscope during a temperature increase from 20°C to 40°C. The reason for using a confocal<br />
microscope lies in the necessity to have a high resolution, which is necessary in order to<br />
separate the fluorescence contribution of the solution from that of the pattern. The pictures<br />
obtained showed a very intense and well defined fluorescent pattern at room temperature,<br />
whose intensity and definition decreased by increasing the temperature of the solution. At the<br />
end of the experiment the pattern was hardly detectable (Figure 5-7).<br />
99