View - DSpace UniPR
View - DSpace UniPR
View - DSpace UniPR

Create successful ePaper yourself
Turn your PDF publications into a flip-book with our unique Google optimized e-Paper software.
Chapter 5<br />
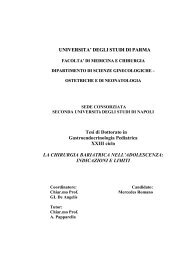
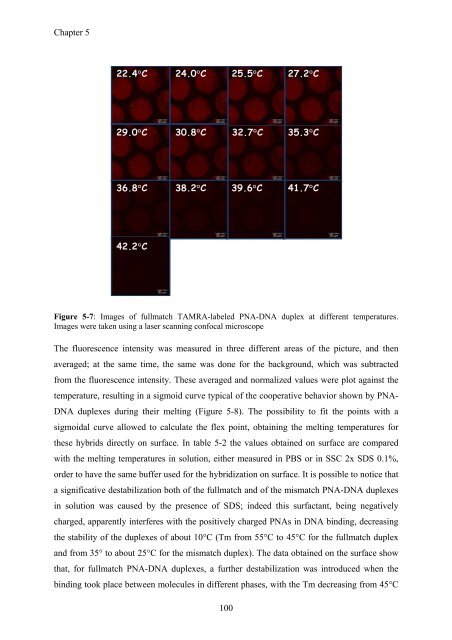
22.4°C 24.0°C 25.5°C 27.2°C<br />
29.0°C 30.8°C 32.7°C 35.3°C<br />
36.8°C 38.2°C 39.6°C 41.7°C<br />
42.2°C<br />
Figure 5-7: Images of fullmatch TAMRA-labeled PNA-DNA duplex at different temperatures.<br />
Images were taken using a laser scanning confocal microscope<br />
The fluorescence intensity was measured in three different areas of the picture, and then<br />
averaged; at the same time, the same was done for the background, which was subtracted<br />
from the fluorescence intensity. These averaged and normalized values were plot against the<br />
temperature, resulting in a sigmoid curve typical of the cooperative behavior shown by PNA-<br />
DNA duplexes during their melting (Figure 5-8). The possibility to fit the points with a<br />
sigmoidal curve allowed to calculate the flex point, obtaining the melting temperatures for<br />
these hybrids directly on surface. In table 5-2 the values obtained on surface are compared<br />
with the melting temperatures in solution, either measured in PBS or in SSC 2x SDS 0.1%,<br />
order to have the same buffer used for the hybridization on surface. It is possible to notice that<br />
a significative destabilization both of the fullmatch and of the mismatch PNA-DNA duplexes<br />
in solution was caused by the presence of SDS; indeed this surfactant, being negatively<br />
charged, apparently interferes with the positively charged PNAs in DNA binding, decreasing<br />
the stability of the duplexes of about 10°C (Tm from 55°C to 45°C for the fullmatch duplex<br />
and from 35° to about 25°C for the mismatch duplex). The data obtained on the surface show<br />
that, for fullmatch PNA-DNA duplexes, a further destabilization was introduced when the<br />
binding took place between molecules in different phases, with the Tm decreasing from 45°C<br />
100