- Page 1 and 2: IUCN Publications new series No. 23
- Page 3 and 4: I n t he bear park on Hokkai do. (P
- Page 5 and 6: Bear Proceedings © IUCN, Morges, S
- Page 7 and 8: Contents Introduction to the biolog
- Page 9 and 10: Introduction to the Biology and Man
- Page 11 and 12: National parks in the United States
- Page 13 and 14: Dr. Krott studied the behaviour of
- Page 15 and 16: LENTFER, J. W., HENSEL, R. J., MILL
- Page 17 and 18: PANEL 1: THE ECOLOGY, POPULATION CH
- Page 19 and 20: dary. This procedure has the advant
- Page 21 and 22: TABLE 2. ACTIVITY AREA DATA FROM FO
- Page 23 and 24: found along adjacent foothills. Low
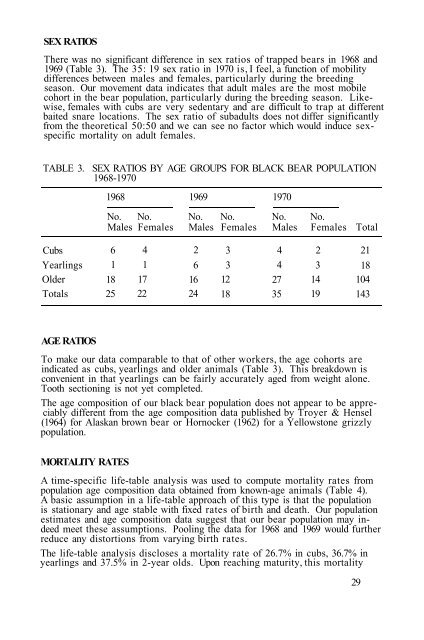
- Page 25: numerous census techniques and in m
- Page 29 and 30: HARTLEY, H. O. 1958. Maximum likeli
- Page 31 and 32: to the grizzlies, soapberry (Shephe
- Page 33 and 34: In an area of approximately 500 squ
- Page 35 and 36: cruises of known mileage by foot an
- Page 37 and 38: 156 miles on the Sugar lands route
- Page 39 and 40: From a total of 92 survey forms dis
- Page 41 and 42: PANEL 1: THE ECOLOGY, POPULATION CH
- Page 43 and 44: Fig. 1 Location of standard canine
- Page 45 and 46: TABLE 2. PRODUCT-MOMENT CORRELATION
- Page 47 and 48: FIG. 2. Age structure of the 1967 b
- Page 49 and 50: However, certain relationships were
- Page 51 and 52: PANEL 1: THE ECOLOGY, POPULATION CH
- Page 53 and 54: head from these bears. Commission p
- Page 55 and 56: Fig. 1. Distribution of 1969 grizzl
- Page 57 and 58: TABLE 4. ANNUAL HARVEST OF GRIZZLY
- Page 59 and 60: on an offal pile or on a deer or el
- Page 61 and 62: An undetermined species of hookworm
- Page 63 and 64: Providing information to personnel
- Page 65 and 66: Fig. 1 Distribution and abundance o
- Page 67 and 68: still winter conditions. On emergin
- Page 69 and 70: utting time were in an exhausted st
- Page 71 and 72: PANEL 1: THE ECOLOGY, POPULATION CH
- Page 73 and 74: ut recent information is lacking. F
- Page 75 and 76: Simultaneously the isolated souther
- Page 77 and 78:
CONSERVATION The brown bear is not
- Page 79 and 80:
F. Craighead. In the Yellowstone po
- Page 81 and 82:
PANEL 2: DENNING—CONTROL MECHANIS
- Page 83 and 84:
Fig. 1 Radio location system Fig. 2
- Page 85 and 86:
neck diameter by inserting two scre
- Page 87 and 88:
Fig. 5 Bearings of transmitter sign
- Page 89 and 90:
TABLE 4. CHARACTERISTICS OF ACTIVE
- Page 91 and 92:
TABLE 5. CHARACTERISTICS OF INACTIV
- Page 93 and 94:
Fig. 7 Location of den of No. 40 by
- Page 95 and 96:
Fig. 10 Den of sow No. 40 (1966), s
- Page 97 and 98:
the cave, she could discourage unso
- Page 99 and 100:
emained in the den. In late afterno
- Page 101 and 102:
Our observations reveal that mature
- Page 103 and 104:
, , 1971. Biotelemetry Research wit
- Page 105 and 106:
winter denning of bears to allow an
- Page 107 and 108:
Fig. 1 View of den excavated by bla
- Page 109 and 110:
from the earth as a heat sink to th
- Page 111 and 112:
DENNING OF POLAR BEARS Conditions T
- Page 113 and 114:
Fig. 6 Polar bear maximum and minim
- Page 115 and 116:
and experiments of Whalen (1965) ar
- Page 117 and 118:
throughout the year on wild caught
- Page 119 and 120:
Fig. 9 EKG intervals of mammals. No
- Page 121 and 122:
SOUTH, F. E. & HOUSE, W. A. 1967. E
- Page 123 and 124:
willow and grasses in mountainous a
- Page 125 and 126:
TABLE 1. FREQUENCY DISTRIBUTION OF
- Page 127 and 128:
TABLE 3. DIMENSIONS IN FEET OF 26 B
- Page 129 and 130:
Fig. 2 Three den types: (A) atypica
- Page 131 and 132:
to 40°F; nice clear high pressure
- Page 133 and 134:
around that you could equate to a p
- Page 135 and 136:
PANEL 3: POLAR BEAR STUDIES Infra-r
- Page 137 and 138:
projection on a screen or on photog
- Page 139 and 140:
PANEL 3: POLAR BEAR STUDIES Further
- Page 141 and 142:
RESULTS A major polar bear winter d
- Page 143 and 144:
A small number of denned adults wit
- Page 145 and 146:
Fig. 6 A winter den of a female and
- Page 147 and 148:
ears has never been reported outsid
- Page 149 and 150:
gravel areas shallow dens are dug l
- Page 151 and 152:
Fig. 11 Diagram of a typical deep b
- Page 153 and 154:
DISCUSSION The winter polar bear de
- Page 155 and 156:
Even the winter dens differ from th
- Page 157 and 158:
Until 1970, the following major law
- Page 159 and 160:
He states that there is a connectio
- Page 161 and 162:
7. LÖNÖ, O. 1970. Norsk Polarinst
- Page 163 and 164:
Polar pack ice covers the central p
- Page 165 and 166:
POLAR BEAR DISTRIBUTION IN RELATION
- Page 167 and 168:
from the vicinity of Wrangel Island
- Page 169 and 170:
PANEL 3: POLAR BEAR STUDIES Immobil
- Page 171 and 172:
After firing we kept watch over the
- Page 173 and 174:
RESULTS Results of the experiments
- Page 175 and 176:
} Duration of immobilization; comme
- Page 177 and 178:
One attempt was made to immobilize
- Page 179 and 180:
BREEDING ECOLOGY General informatio
- Page 181 and 182:
Fig. 1 The Drem-Head mountains, an
- Page 183 and 184:
TABLE 2. DISTRIBUTION OF DENS ACCOR
- Page 185 and 186:
Fig. 5 Structure of 6 dens: 1. (a)
- Page 187 and 188:
Fig. 7 Interior of den, showing cla
- Page 189 and 190:
We were lucky to observe three time
- Page 191 and 192:
In the upper reaches of the Neozhid
- Page 193 and 194:
In good weather, opened dens with s
- Page 195 and 196:
PANEL 3: POLAR BEAR STUDIES SUMMARY
- Page 197 and 198:
not be done, the hunter was given a
- Page 199 and 200:
Fig. 1 The contribution of year cla
- Page 201 and 202:
DISCUSSION Fluctuations in bear har
- Page 203 and 204:
REFERENCES FREE, S.& SAUER, P.R. 19
- Page 205 and 206:
the primate temporal lobe which is
- Page 207 and 208:
Fig. 1 The two cubs sucking on the
- Page 209 and 210:
Kit drank more on only 15. In June
- Page 211 and 212:
would immediately show interest, co
- Page 213 and 214:
Fig. 5 Resting self-play with branc
- Page 215 and 216:
A highly developed greeting ceremon
- Page 217 and 218:
KROTT, P. & KROTT, G. 1963. Zum Ver
- Page 219 and 220:
EVOLUTION OF BLACK BEARS AND THE BR
- Page 221 and 222:
they did not in general cease their
- Page 223 and 224:
Fig. 4 Fig. 3 226
- Page 225 and 226:
Many field observations suggest tha
- Page 227 and 228:
groups even with very frequent dump
- Page 229 and 230:
PANEL 4: BEAR BEHAVIOUR Social Beha
- Page 231 and 232:
The capture and tagging of 13 bears
- Page 233 and 234:
TABLE 3. SOCIAL RANK OF 22 BEARS OB
- Page 235 and 236:
TABLE 4. BEHAVIOR COMPONENTS OF BEA
- Page 237 and 238:
Fig 5 Bear 'confronting' an opponen
- Page 239 and 240:
Bears at the falls minimized compet
- Page 241 and 242:
the same manner as Mr. Stonorov obs
- Page 243 and 244:
males have their way. I'd say this,
- Page 245 and 246:
my way back to camp and I'd carried
- Page 247 and 248:
ears in Montana. It was masked by g
- Page 249 and 250:
ears like that, the subadults, usua
- Page 251 and 252:
The second observation I want to ma
- Page 253 and 254:
In the summer of 1969,Mr.Carlye Bla
- Page 255 and 256:
TABLE 1. DEMOGRAPHIC CHARACTERISTIC
- Page 257 and 258:
TABLE 3. KNOWLEDGE OF BLACK BEAR FO
- Page 259 and 260:
conception of the size of the black
- Page 261 and 262:
Occupation Occupation was not relat
- Page 263 and 264:
TABLE 6. ATTITUDE TOWARD ANIMALS IN
- Page 265 and 266:
The Elkmont campers were most conce
- Page 267 and 268:
TABLE 9. VISITOR ATTITUDE CONCERNIN
- Page 269 and 270:
TABLE 12. ANSWERS OF VISITORS TO QU
- Page 271 and 272:
PANEL 5: BEARS AND HUMAN BEINGS Pre
- Page 273 and 274:
number of visitors per year was abo
- Page 275 and 276:
TABLE 1. RELATIONSHIPS BETWEEN CAMP
- Page 277 and 278:
that fed at a dump. Weaned young, s
- Page 279 and 280:
TABLE 3. RECORDS ON GRIZZLY-CAUSED
- Page 281 and 282:
Canyon. Other coinciding circumstan
- Page 283 and 284:
number of intrusions into park deve
- Page 285 and 286:
REFERENCES CRAIGHEAD, J. J., HORNOC
- Page 287 and 288:
Glacier National Park Glacier Natio
- Page 289 and 290:
settlements in the park. Arthur Whe
- Page 291 and 292:
will be summarised here to provide
- Page 293 and 294:
C.P.R. 1889. Fishing and Shooting o
- Page 295 and 296:
Much later, in 1875, George Bird Gr
- Page 297 and 298:
its community. In other words, its
- Page 299 and 300:
COUES, Elliott (Ed.) 1965a. New lig
- Page 301 and 302:
PANEL 5: BEARS AND HUMAN BEINGS Gri
- Page 303 and 304:
to and after this month. Our census
- Page 305 and 306:
They have shaped and are integrally
- Page 307 and 308:
individually and quantitatively doc
- Page 309 and 310:
ecome thoroughly conditioned to man
- Page 311 and 312:
National Park Service Report, 'Griz
- Page 313 and 314:
This just equals the average annual
- Page 315 and 316:
has helped the sanitation problem.
- Page 317 and 318:
3 years of phase-out (Table 7). Thu
- Page 319 and 320:
TABLE 8. CAMPGROUND CAPTURES OF FIV
- Page 321 and 322:
TABLE 9. DISPERSAL OF 34 COLOR-MARK
- Page 323 and 324:
Fig. 6 Dispersal of 34 marked and t
- Page 325 and 326:
Fig. 10 A grizzly individually mark
- Page 327 and 328:
No. 8 moved 14 airline miles to the
- Page 329 and 330:
CRAIGHEAD, J. J. & CRAIGHEAD, F. C.
- Page 331 and 332:
PANEL 5: BEARS AND HUMAN BEINGS SUM
- Page 333 and 334:
ears present the least conflict wit
- Page 335 and 336:
een marked. This could be done alon
- Page 337 and 338:
spring and fall and so in a way it
- Page 339 and 340:
that we would have too much difficu
- Page 341 and 342:
and southward into the Mizo Hills a
- Page 343 and 344:
now but a relict population, is und
- Page 345 and 346:
This suggests a population of close
- Page 347 and 348:
Yoho, Kootenay and Glacier National
- Page 349 and 350:
support approximately 3, 300 bears
- Page 351 and 352:
Natural mortality is estimated at a
- Page 353 and 354:
TABLE 2. BLACK BEAR GAME STATUS STA
- Page 355 and 356:
TABLE 3. KILL FIGURES FOR BLACK BEA
- Page 357 and 358:
The research already undertaken has
- Page 359 and 360:
smallest takes is 11 bears from a t
- Page 361 and 362:
transplant or into zoos may have to
- Page 363 and 364:
HATLER,D. F. 1967. Some aspects in
- Page 365 and 366:
Index Figures in bold type are rele
- Page 367 and 368:
INDEX OF OTHERS WHO PARTICIPATED IN