size: 5036KB - Crocodile Specialist Group
size: 5036KB - Crocodile Specialist Group
size: 5036KB - Crocodile Specialist Group

You also want an ePaper? Increase the reach of your titles
YUMPU automatically turns print PDFs into web optimized ePapers that Google loves.
toz<br />
a maximum of 12 locations for an individual'<br />
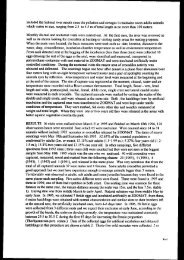
1.1) Mark-resight results<br />
ri" ,oi"trtins iat" trable 1), an index which reflects the proportion of tagged animals in the<br />
;;ffi;,;.a.;d *i*rui"a This is broken down bv time in months after release and<br />
iorrected for samplitrg effort.<br />
Table 1. Resighting rate each month since release, calculated from the number of tagged<br />
animals seen, corrected for sampling effort'<br />
Month<br />
Km<br />
Sampled<br />
Number<br />
Seen<br />
Correction<br />
Factor<br />
Resighting<br />
Rate<br />
Comments<br />
MARCH 29.'75 l5 1.43 lst batch<br />
APRIL 26.50 49 1.60<br />
MAY 40.25 60 1.06<br />
JUNE 42.50 53 r .00<br />
JULY 18.75 19 2.21<br />
The decline in the resighting Iate seen in Table 1 rcflects the combined loss of tagged<br />
animals from mortality, emigration and tag loss Emigration is-discounted.as considerable<br />
efforts have been made to locate tagged animals outside the study area' wlthorlt success'<br />
Tag loss is the biggest source of bias. Three means of estimating tag loss were built inlo the<br />
deien - all animals carry both permanent marks (cut scutes) and temporary marks (head<br />
l*tit-", *.fl sighting th; condilion and presence/absqnce of both lead- tags is specifically<br />
Jt i; utotig tnJradio tagged animals, half have head tags and half have not' allowing<br />
iot "na ill"n these animals are recaPtured for measuremenl. Lost ta€s are rcplaced<br />
wheneverananimalishandledandmodifiedtagsarenowbgingappliedwhichalelessprone<br />
"orputiton<br />
to working loose.<br />
It is estimated flom sighting that tag loss in the first 3 months after release was around 10 %'<br />
it e ttti. loss on the pool of tagged animals available for sighting does<br />
"umututiue"feciof<br />
not alone explain the decline seen in Table l'<br />
A sepamte analysis also indicates that the numbers available for resighting are decreasing<br />
inroriet time. ihe ratio of firsr sighrings of a tag to second or repeat sightings has droPped<br />
markedly each month since the release (Table 2).