The European e-Business Report The European e ... - empirica
The European e-Business Report The European e ... - empirica
The European e-Business Report The European e ... - empirica

Create successful ePaper yourself
Turn your PDF publications into a flip-book with our unique Google optimized e-Paper software.
<strong>The</strong> <strong>European</strong><br />
e-<strong>Business</strong> W@tch<br />
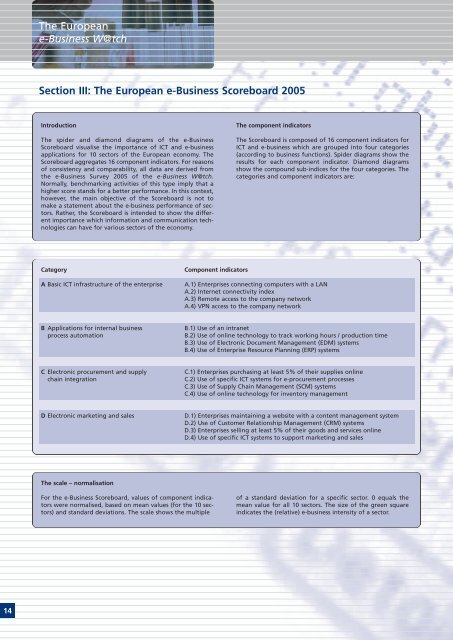
Section III: <strong>The</strong> <strong>European</strong> e-<strong>Business</strong> Scoreboard 2005<br />
Introduction<br />
<strong>The</strong> spider and diamond diagrams of the e-<strong>Business</strong><br />
Scoreboard visualise the importance of ICT and e-business<br />
applications for 10 sectors of the <strong>European</strong> economy. <strong>The</strong><br />
Scoreboard aggregates 16 component indicators. For reasons<br />
of consistency and comparability, all data are derived from<br />
the e-<strong>Business</strong> Survey 2005 of the e-<strong>Business</strong> W@tch.<br />
Normally, benchmarking activities of this type imply that a<br />
higher score stands for a better performance. In this context,<br />
however, the main objective of the Scoreboard is not to<br />
make a statement about the e-business performance of sectors.<br />
Rather, the Scoreboard is intended to show the different<br />
importance which information and communication technologies<br />
can have for various sectors of the economy.<br />
<strong>The</strong> component indicators<br />
<strong>The</strong> Scoreboard is composed of 16 component indicators for<br />
ICT and e-business which are grouped into four categories<br />
(according to business functions). Spider diagrams show the<br />
results for each component indicator. Diamond diagrams<br />
show the compound sub-indices for the four categories. <strong>The</strong><br />
categories and component indicators are:<br />
Category<br />
A Basic ICT infrastructure of the enterprise<br />
Component indicators<br />
A.1) Enterprises connecting computers with a LAN<br />
A.2) Internet connectivity index<br />
A.3) Remote access to the company network<br />
A.4) VPN access to the company network<br />
B Applications for internal business<br />
process automation<br />
B.1) Use of an intranet<br />
B.2) Use of online technology to track working hours / production time<br />
B.3) Use of Electronic Document Management (EDM) systems<br />
B.4) Use of Enterprise Resource Planning (ERP) systems<br />
C Electronic procurement and supply<br />
chain integration<br />
C.1) Enterprises purchasing at least 5% of their supplies online<br />
C.2) Use of specific ICT systems for e-procurement processes<br />
C.3) Use of Supply Chain Management (SCM) systems<br />
C.4) Use of online technology for inventory management<br />
D Electronic marketing and sales<br />
D.1) Enterprises maintaining a website with a content management system<br />
D.2) Use of Customer Relationship Management (CRM) systems<br />
D.3) Enterprises selling at least 5% of their goods and services online<br />
D.4) Use of specific ICT systems to support marketing and sales<br />
<strong>The</strong> scale – normalisation<br />
For the e-<strong>Business</strong> Scoreboard, values of component indicators<br />
were normalised, based on mean values (for the 10 sectors)<br />
and standard deviations. <strong>The</strong> scale shows the multiple<br />
of a standard deviation for a specific sector. 0 equals the<br />
mean value for all 10 sectors. <strong>The</strong> size of the green square<br />
indicates the (relative) e-business intensity of a sector.<br />
14