The European e-Business Report The European e ... - empirica
The European e-Business Report The European e ... - empirica
The European e-Business Report The European e ... - empirica

You also want an ePaper? Increase the reach of your titles
YUMPU automatically turns print PDFs into web optimized ePapers that Google loves.
<strong>The</strong> <strong>European</strong> E-<strong>Business</strong> <strong>Report</strong> 2005<br />
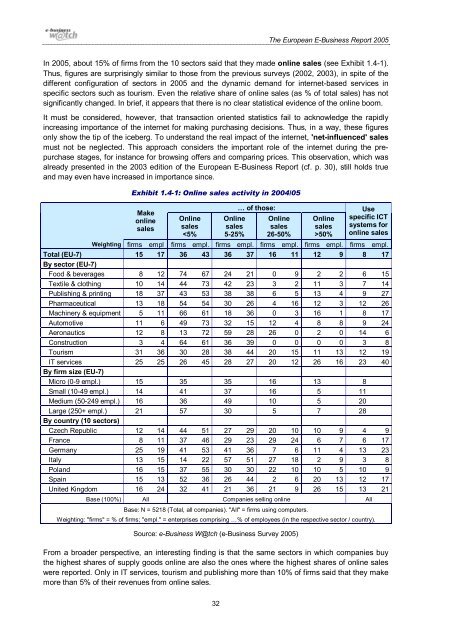
In 2005, about 15% of firms from the 10 sectors said that they made online sales (see Exhibit 1.4-1).<br />
Thus, figures are surprisingly similar to those from the previous surveys (2002, 2003), in spite of the<br />
different configuration of sectors in 2005 and the dynamic demand for internet-based services in<br />
specific sectors such as tourism. Even the relative share of online sales (as % of total sales) has not<br />
significantly changed. In brief, it appears that there is no clear statistical evidence of the online boom.<br />
It must be considered, however, that transaction oriented statistics fail to acknowledge the rapidly<br />
increasing importance of the internet for making purchasing decisions. Thus, in a way, these figures<br />
only show the tip of the iceberg. To understand the real impact of the internet, 'net-influenced' sales<br />
must not be neglected. This approach considers the important role of the internet during the prepurchase<br />
stages, for instance for browsing offers and comparing prices. This observation, which was<br />
already presented in the 2003 edition of the <strong>European</strong> E-<strong>Business</strong> <strong>Report</strong> (cf. p. 30), still holds true<br />
and may even have increased in importance since.<br />
Exhibit 1.4-1: Online sales activity in 2004/05<br />
Make<br />
online<br />
sales<br />
Online<br />
sales<br />
50%<br />
Use<br />
specific ICT<br />
systems for<br />
online sales<br />
Weighting firms empl firms empl. firms empl. firms empl. firms empl. firms empl.<br />
Total (EU-7) 15 17 36 43 36 37 16 11 12 9 8 17<br />
By sector (EU-7)<br />
Food & beverages 8 12 74 67 24 21 0 9 2 2 6 15<br />
Textile & clothing 10 14 44 73 42 23 3 2 11 3 7 14<br />
Publishing & printing 18 37 43 53 38 38 6 5 13 4 9 27<br />
Pharmaceutical 13 18 54 54 30 26 4 16 12 3 12 26<br />
Machinery & equipment 5 11 66 61 18 36 0 3 16 1 8 17<br />
Automotive 11 6 49 73 32 15 12 4 8 8 9 24<br />
Aeronautics 12 8 13 72 59 28 26 0 2 0 14 6<br />
Construction 3 4 64 61 36 39 0 0 0 0 3 8<br />
Tourism 31 36 30 28 38 44 20 15 11 13 12 19<br />
IT services 25 25 26 45 28 27 20 12 26 16 23 40<br />
By firm size (EU-7)<br />
Micro (0-9 empl.) 15 35 35 16 13 8<br />
Small (10-49 empl.) 14 41 37 16 5 11<br />
Medium (50-249 empl.) 16 36 49 10 5 20<br />
Large (250+ empl.) 21 57 30 5 7 28<br />
By country (10 sectors)<br />
Czech Republic 12 14 44 51 27 29 20 10 10 9 4 9<br />
France 8 11 37 46 29 23 29 24 6 7 6 17<br />
Germany 25 19 41 53 41 36 7 6 11 4 13 23<br />
Italy 13 15 14 22 57 51 27 18 2 9 3 8<br />
Poland 16 15 37 55 30 30 22 10 10 5 10 9<br />
Spain 15 13 52 36 26 44 2 6 20 13 12 17<br />
United Kingdom 16 24 32 41 21 36 21 9 26 15 13 21<br />
Base (100%) All Companies selling online All<br />
Base: N = 5218 (Total, all companies). "All" = firms using computers.<br />
Weighting: "firms" = % of firms; "empl." = enterprises comprising …% of employees (in the respective sector / country).<br />
Source: e-<strong>Business</strong> W@tch (e-<strong>Business</strong> Survey 2005)<br />
From a broader perspective, an interesting finding is that the same sectors in which companies buy<br />
the highest shares of supply goods online are also the ones where the highest shares of online sales<br />
were reported. Only in IT services, tourism and publishing more than 10% of firms said that they make<br />
more than 5% of their revenues from online sales.<br />
32