Hydraulic Design of Highway Culverts - DOT On-Line Publications
Hydraulic Design of Highway Culverts - DOT On-Line Publications
Hydraulic Design of Highway Culverts - DOT On-Line Publications

Create successful ePaper yourself
Turn your PDF publications into a flip-book with our unique Google optimized e-Paper software.
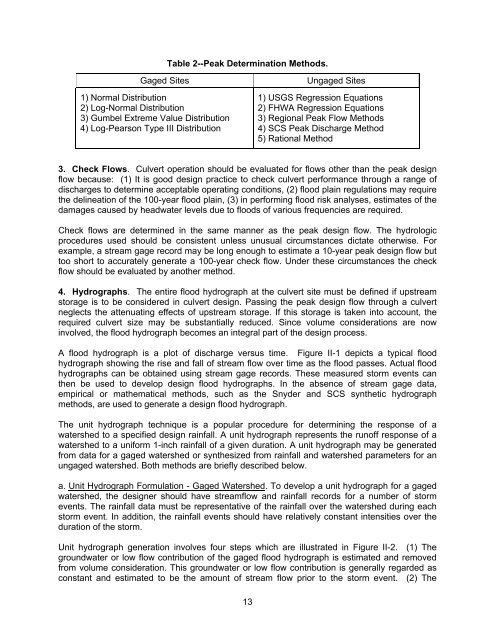
Table 2--Peak Determination Methods.<br />
Gaged Sites Ungaged Sites<br />
1) Normal Distribution<br />
2) Log-Normal Distribution<br />
3) Gumbel Extreme Value Distribution<br />
4) Log-Pearson Type III Distribution<br />
13<br />
1) USGS Regression Equations<br />
2) FHWA Regression Equations<br />
3) Regional Peak Flow Methods<br />
4) SCS Peak Discharge Method<br />
5) Rational Method<br />
3. Check Flows. Culvert operation should be evaluated for flows other than the peak design<br />
flow because: (1) It is good design practice to check culvert performance through a range <strong>of</strong><br />
discharges to determine acceptable operating conditions, (2) flood plain regulations may require<br />
the delineation <strong>of</strong> the 100-year flood plain, (3) in performing flood risk analyses, estimates <strong>of</strong> the<br />
damages caused by headwater levels due to floods <strong>of</strong> various frequencies are required.<br />
Check flows are determined in the same manner as the peak design flow. The hydrologic<br />
procedures used should be consistent unless unusual circumstances dictate otherwise. For<br />
example, a stream gage record may be long enough to estimate a 10-year peak design flow but<br />
too short to accurately generate a 100-year check flow. Under these circumstances the check<br />
flow should be evaluated by another method.<br />
4. Hydrographs. The entire flood hydrograph at the culvert site must be defined if upstream<br />
storage is to be considered in culvert design. Passing the peak design flow through a culvert<br />
neglects the attenuating effects <strong>of</strong> upstream storage. If this storage is taken into account, the<br />
required culvert size may be substantially reduced. Since volume considerations are now<br />
involved, the flood hydrograph becomes an integral part <strong>of</strong> the design process.<br />
A flood hydrograph is a plot <strong>of</strong> discharge versus time. Figure II-1 depicts a typical flood<br />
hydrograph showing the rise and fall <strong>of</strong> stream flow over time as the flood passes. Actual flood<br />
hydrographs can be obtained using stream gage records. These measured storm events can<br />
then be used to develop design flood hydrographs. In the absence <strong>of</strong> stream gage data,<br />
empirical or mathematical methods, such as the Snyder and SCS synthetic hydrograph<br />
methods, are used to generate a design flood hydrograph.<br />
The unit hydrograph technique is a popular procedure for determining the response <strong>of</strong> a<br />
watershed to a specified design rainfall. A unit hydrograph represents the run<strong>of</strong>f response <strong>of</strong> a<br />
watershed to a uniform 1-inch rainfall <strong>of</strong> a given duration. A unit hydrograph may be generated<br />
from data for a gaged watershed or synthesized from rainfall and watershed parameters for an<br />
ungaged watershed. Both methods are briefly described below.<br />
a. Unit Hydrograph Formulation - Gaged Watershed. To develop a unit hydrograph for a gaged<br />
watershed, the designer should have streamflow and rainfall records for a number <strong>of</strong> storm<br />
events. The rainfall data must be representative <strong>of</strong> the rainfall over the watershed during each<br />
storm event. In addition, the rainfall events should have relatively constant intensities over the<br />
duration <strong>of</strong> the storm.<br />
Unit hydrograph generation involves four steps which are illustrated in Figure II-2. (1) The<br />
groundwater or low flow contribution <strong>of</strong> the gaged flood hydrograph is estimated and removed<br />
from volume consideration. This groundwater or low flow contribution is generally regarded as<br />
constant and estimated to be the amount <strong>of</strong> stream flow prior to the storm event. (2) The