Mass and Light distributions in Clusters of Galaxies - Henry A ...
Mass and Light distributions in Clusters of Galaxies - Henry A ...
Mass and Light distributions in Clusters of Galaxies - Henry A ...
You also want an ePaper? Increase the reach of your titles
YUMPU automatically turns print PDFs into web optimized ePapers that Google loves.
<strong>Mass</strong> <strong>and</strong> <strong>Light</strong> <strong>of</strong> A1703, A370 & RXJ1347-11<br />
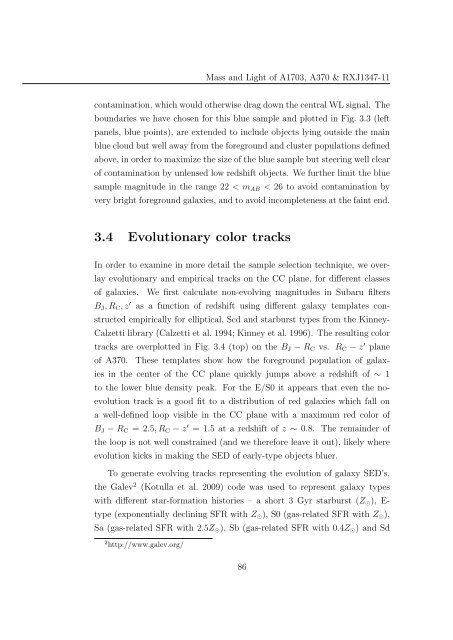
contam<strong>in</strong>ation, which would otherwise drag down the central WL signal. The<br />
boundaries we have chosen for this blue sample <strong>and</strong> plotted <strong>in</strong> Fig. 3.3 (left<br />
panels, blue po<strong>in</strong>ts), are extended to <strong>in</strong>clude objects ly<strong>in</strong>g outside the ma<strong>in</strong><br />
blue cloud but well away from the foreground <strong>and</strong> cluster populations def<strong>in</strong>ed<br />
above, <strong>in</strong> order to maximize the size <strong>of</strong> the blue sample but steer<strong>in</strong>g well clear<br />
<strong>of</strong> contam<strong>in</strong>ation by unlensed low redshift objects. We further limit the blue<br />
sample magnitude <strong>in</strong> the range 22 < m AB < 26 to avoid contam<strong>in</strong>ation by<br />
very bright foreground galaxies, <strong>and</strong> to avoid <strong>in</strong>completeness at the fa<strong>in</strong>t end.<br />
3.4 Evolutionary color tracks<br />
In order to exam<strong>in</strong>e <strong>in</strong> more detail the sample selection technique, we overlay<br />
evolutionary <strong>and</strong> empirical tracks on the CC plane, for different classes<br />
<strong>of</strong> galaxies. We first calculate non-evolv<strong>in</strong>g magnitudes <strong>in</strong> Subaru filters<br />
B J , R C , z ′ as a function <strong>of</strong> redshift us<strong>in</strong>g different galaxy templates constructed<br />
empirically for elliptical, Scd <strong>and</strong> starburst types from the K<strong>in</strong>ney-<br />
Calzetti library (Calzetti et al. 1994; K<strong>in</strong>ney et al. 1996). The result<strong>in</strong>g color<br />
tracks are overplotted <strong>in</strong> Fig. 3.4 (top) on the B J − R C vs. R C − z ′ plane<br />
<strong>of</strong> A370. These templates show how the foreground population <strong>of</strong> galaxies<br />
<strong>in</strong> the center <strong>of</strong> the CC plane quickly jumps above a redshift <strong>of</strong> ∼ 1<br />
to the lower blue density peak. For the E/S0 it appears that even the noevolution<br />
track is a good fit to a distribution <strong>of</strong> red galaxies which fall on<br />
a well-def<strong>in</strong>ed loop visible <strong>in</strong> the CC plane with a maximum red color <strong>of</strong><br />
B J − R C = 2.5, R C − z ′ = 1.5 at a redshift <strong>of</strong> z ∼ 0.8. The rema<strong>in</strong>der <strong>of</strong><br />
the loop is not well constra<strong>in</strong>ed (<strong>and</strong> we therefore leave it out), likely where<br />
evolution kicks <strong>in</strong> mak<strong>in</strong>g the SED <strong>of</strong> early-type objects bluer.<br />
To generate evolv<strong>in</strong>g tracks represent<strong>in</strong>g the evolution <strong>of</strong> galaxy SED’s,<br />
the Galev 2 (Kotulla et al. 2009) code was used to represent galaxy types<br />
with different star-formation histories – a short 3 Gyr starburst (Z ⊙ ), E-<br />
type (exponentially decl<strong>in</strong><strong>in</strong>g SFR with Z ⊙ ), S0 (gas-related SFR with Z ⊙ ),<br />
Sa (gas-related SFR with 2.5Z ⊙ ), Sb (gas-related SFR with 0.4Z ⊙ ) <strong>and</strong> Sd<br />
2 http://www.galev.org/<br />
86


