

Mass and Light distributions in Clusters of Galaxies - Henry A ...
Mass and Light distributions in Clusters of Galaxies - Henry A ...
Mass and Light distributions in Clusters of Galaxies - Henry A ...

Create successful ePaper yourself
Turn your PDF publications into a flip-book with our unique Google optimized e-Paper software.
2.B Non-l<strong>in</strong>ear effect <strong>in</strong> the reduced shear estimate<br />
10 0 θ [arcm<strong>in</strong>]<br />
c vir<br />
=27<br />
c vir<br />
=14<br />
c vir<br />
=8<br />
c vir<br />
=5<br />
Distortion g +<br />
10 −1<br />
10 −2<br />
0 2 4 6 8 10 12 14 16<br />
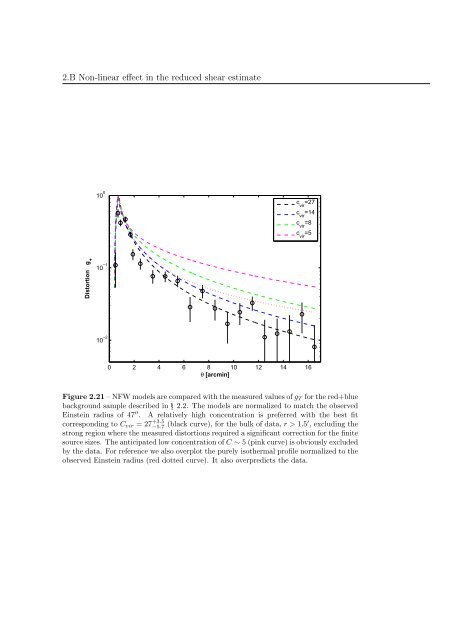
Figure 2.21 – NFW models are compared with the measured values <strong>of</strong> g T for the red+blue<br />
background sample described <strong>in</strong> § 2.2. The models are normalized to match the observed<br />
E<strong>in</strong>ste<strong>in</strong> radius <strong>of</strong> 47 ′′ . A relatively high concentration is preferred with the best fit<br />
correspond<strong>in</strong>g to C vir = 27 −5.7 +3.5 (black curve), for the bulk <strong>of</strong> data, r > 1.5′ , exclud<strong>in</strong>g the<br />
strong region where the measured distortions required a significant correction for the f<strong>in</strong>ite<br />
source sizes. The anticipated low concentration <strong>of</strong> C ∼ 5 (p<strong>in</strong>k curve) is obviously excluded<br />
by the data. For reference we also overplot the purely isothermal pr<strong>of</strong>ile normalized to the<br />
observed E<strong>in</strong>ste<strong>in</strong> radius (red dotted curve). It also overpredicts the data.


