

Mass and Light distributions in Clusters of Galaxies - Henry A ...
Mass and Light distributions in Clusters of Galaxies - Henry A ...
Mass and Light distributions in Clusters of Galaxies - Henry A ...

Create successful ePaper yourself
Turn your PDF publications into a flip-book with our unique Google optimized e-Paper software.
4.5 Results<br />
Γ (g T<br />
amplitude ratio)<br />
2<br />
1<br />
0<br />
−1<br />
2<br />
1<br />
0<br />
2<br />
0<br />
2<br />
03<br />
2<br />
1<br />
0<br />
20 21 22 23 24 25 26<br />
z’ [mag]<br />
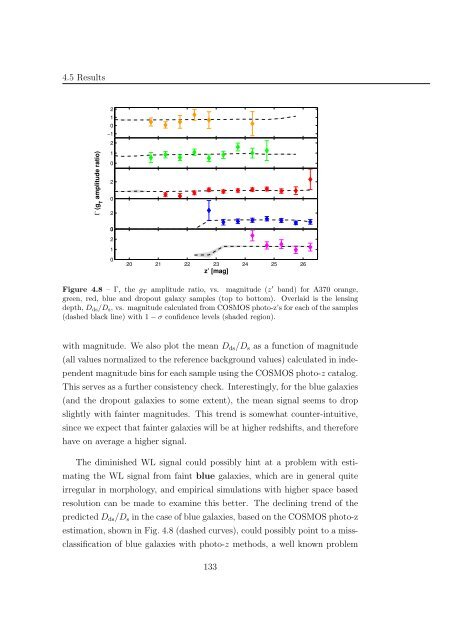
Figure 4.8 – Γ, the g T amplitude ratio, vs. magnitude (z ′ b<strong>and</strong>) for A370 orange,<br />
green, red, blue <strong>and</strong> dropout galaxy samples (top to bottom). Overlaid is the lens<strong>in</strong>g<br />
depth, D ds /D s , vs. magnitude calculated from COSMOS photo-z’s for each <strong>of</strong> the samples<br />
(dashed black l<strong>in</strong>e) with 1 − σ confidence levels (shaded region).<br />
with magnitude. We also plot the mean D ds /D s as a function <strong>of</strong> magnitude<br />
(all values normalized to the reference background values) calculated <strong>in</strong> <strong>in</strong>dependent<br />
magnitude b<strong>in</strong>s for each sample us<strong>in</strong>g the COSMOS photo-z catalog.<br />
This serves as a further consistency check. Interest<strong>in</strong>gly, for the blue galaxies<br />
(<strong>and</strong> the dropout galaxies to some extent), the mean signal seems to drop<br />
slightly with fa<strong>in</strong>ter magnitudes. This trend is somewhat counter-<strong>in</strong>tuitive,<br />
s<strong>in</strong>ce we expect that fa<strong>in</strong>ter galaxies will be at higher redshifts, <strong>and</strong> therefore<br />
have on average a higher signal.<br />
The dim<strong>in</strong>ished WL signal could possibly h<strong>in</strong>t at a problem with estimat<strong>in</strong>g<br />
the WL signal from fa<strong>in</strong>t blue galaxies, which are <strong>in</strong> general quite<br />
irregular <strong>in</strong> morphology, <strong>and</strong> empirical simulations with higher space based<br />
resolution can be made to exam<strong>in</strong>e this better. The decl<strong>in</strong><strong>in</strong>g trend <strong>of</strong> the<br />
predicted D ds /D s <strong>in</strong> the case <strong>of</strong> blue galaxies, based on the COSMOS photo-z<br />
estimation, shown <strong>in</strong> Fig. 4.8 (dashed curves), could possibly po<strong>in</strong>t to a missclassification<br />
<strong>of</strong> blue galaxies with photo-z methods, a well known problem<br />
133


