

Mass and Light distributions in Clusters of Galaxies - Henry A ...
Mass and Light distributions in Clusters of Galaxies - Henry A ...
Mass and Light distributions in Clusters of Galaxies - Henry A ...

You also want an ePaper? Increase the reach of your titles
YUMPU automatically turns print PDFs into web optimized ePapers that Google loves.
3.3 Sample selection from the color-color diagram<br />
2<br />
A1703<br />
10<br />
2<br />
A1703<br />
x 10 −6<br />
7<br />
1.8<br />
1.6<br />
1.4<br />
9<br />
8<br />
1.8<br />
1.6<br />
1.4<br />
6<br />
5<br />
g − r<br />
1.2<br />
1<br />
0.8<br />
7<br />
Radius<br />
g − r<br />
1.2<br />
1<br />
0.8<br />
4<br />
3<br />
Number/pix 2<br />
0.6<br />
6<br />
0.6<br />
2<br />
0.4<br />
5<br />
0.4<br />
1<br />
0.2<br />
0.2<br />
−0.4 −0.2 0 0.2 0.4 0.6 0.8<br />
r − i<br />
−0.4 −0.2 0 0.2 0.4 0.6 0.8<br />
r − i<br />
0<br />
A370<br />
13<br />
A370<br />
x 10 −6<br />
7<br />
2<br />
12<br />
2<br />
6<br />
11<br />
5<br />
B − R<br />
1.5<br />
1<br />
10<br />
9<br />
Radius<br />
B − R<br />
1.5<br />
1<br />
4<br />
3<br />
Number/pix 2<br />
8<br />
2<br />
0.5<br />
7<br />
0.5<br />
6<br />
1<br />
0<br />
−0.4 −0.2 0 0.2 0.4 0.6 0.8 1 1.2<br />
R − Z<br />
0<br />
−0.4 −0.2 0 0.2 0.4 0.6 0.8 1 1.2<br />
R − Z<br />
0<br />
1.4<br />
RXJ1347−11<br />
13<br />
1.4<br />
RXJ1347−11<br />
x 10 −6<br />
7<br />
1.2<br />
12<br />
1.2<br />
6<br />
1<br />
11<br />
1<br />
5<br />
V − R<br />
0.8<br />
0.6<br />
0.4<br />
10<br />
9<br />
8<br />
Radius<br />
V − R<br />
0.8<br />
0.6<br />
0.4<br />
4<br />
3<br />
Number/pix 2<br />
0.2<br />
7<br />
0.2<br />
2<br />
0<br />
6<br />
0<br />
1<br />
−0.2<br />
−0.2 0 0.2 0.4 0.6 0.8 1 1.2 1.4<br />
R − Z<br />
5<br />
−0.2<br />
−0.2 0 0.2 0.4 0.6 0.8 1 1.2 1.4<br />
R − Z<br />
0<br />
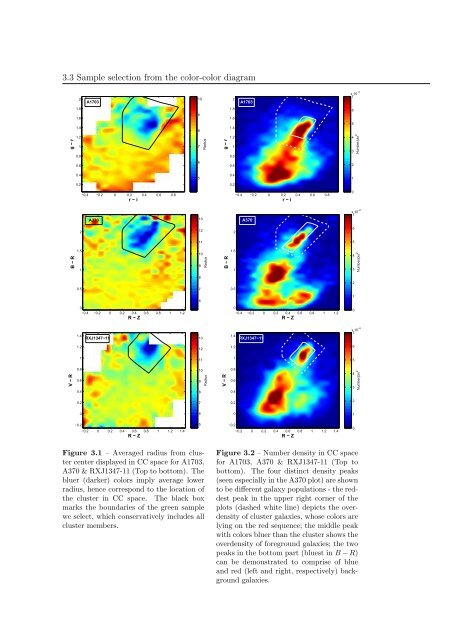
Figure 3.1 – Averaged radius from cluster<br />
center displayed <strong>in</strong> CC space for A1703,<br />
A370 & RXJ1347-11 (Top to bottom). The<br />
bluer (darker) colors imply average lower<br />
radius, hence correspond to the location <strong>of</strong><br />
the cluster <strong>in</strong> CC space. The black box<br />
marks the boundaries <strong>of</strong> the green sample<br />
we select, which conservatively <strong>in</strong>cludes all<br />
cluster members.<br />
Figure 3.2 – Number density <strong>in</strong> CC space<br />
for A1703, A370 & RXJ1347-11 (Top to<br />
bottom). The four dist<strong>in</strong>ct density peaks<br />
(seen especially <strong>in</strong> the A370 plot) are shown<br />
to be different galaxy populations - the reddest<br />
peak <strong>in</strong> the upper right corner <strong>of</strong> the<br />
plots (dashed white l<strong>in</strong>e) depicts the overdensity<br />
<strong>of</strong> cluster galaxies, whose colors are<br />
ly<strong>in</strong>g on the red sequence; the middle peak<br />
with colors bluer than the cluster shows the<br />
overdensity <strong>of</strong> foreground galaxies; the two<br />
peaks <strong>in</strong> the bottom part (bluest <strong>in</strong> B − R)<br />
can be demonstrated to comprise <strong>of</strong> blue<br />
<strong>and</strong> red (left <strong>and</strong> right, respectively) background<br />
galaxies.


