

Mass and Light distributions in Clusters of Galaxies - Henry A ...
Mass and Light distributions in Clusters of Galaxies - Henry A ...
Mass and Light distributions in Clusters of Galaxies - Henry A ...

Create successful ePaper yourself
Turn your PDF publications into a flip-book with our unique Google optimized e-Paper software.
2.8 Cluster lum<strong>in</strong>osity functions<br />
28<br />
d(i’ ACS<br />
)/d(i’ Subaru<br />
)=1.0039±0.0002<br />
26<br />
24<br />
i’ acs<br />
22<br />
20<br />
18<br />
16<br />
16 18 20 22 24 26 28<br />
i’ subaru<br />
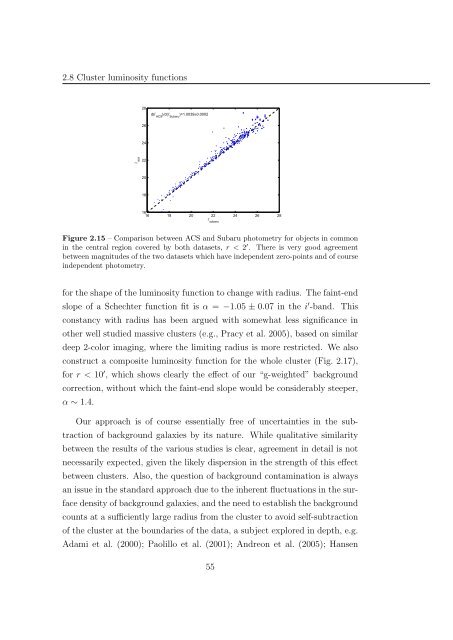
Figure 2.15 – Comparison between ACS <strong>and</strong> Subaru photometry for objects <strong>in</strong> common<br />
<strong>in</strong> the central region covered by both datasets, r < 2 ′ . There is very good agreement<br />
between magnitudes <strong>of</strong> the two datasets which have <strong>in</strong>dependent zero-po<strong>in</strong>ts <strong>and</strong> <strong>of</strong> course<br />
<strong>in</strong>dependent photometry.<br />
for the shape <strong>of</strong> the lum<strong>in</strong>osity function to change with radius. The fa<strong>in</strong>t-end<br />
slope <strong>of</strong> a Schechter function fit is α = −1.05 ± 0.07 <strong>in</strong> the i ′ -b<strong>and</strong>. This<br />
constancy with radius has been argued with somewhat less significance <strong>in</strong><br />
other well studied massive clusters (e.g., Pracy et al. 2005), based on similar<br />
deep 2-color imag<strong>in</strong>g, where the limit<strong>in</strong>g radius is more restricted. We also<br />
construct a composite lum<strong>in</strong>osity function for the whole cluster (Fig. 2.17),<br />
for r < 10 ′ , which shows clearly the effect <strong>of</strong> our “g-weighted” background<br />
correction, without which the fa<strong>in</strong>t-end slope would be considerably steeper,<br />
α ∼ 1.4.<br />
Our approach is <strong>of</strong> course essentially free <strong>of</strong> uncerta<strong>in</strong>ties <strong>in</strong> the subtraction<br />
<strong>of</strong> background galaxies by its nature. While qualitative similarity<br />
between the results <strong>of</strong> the various studies is clear, agreement <strong>in</strong> detail is not<br />
necessarily expected, given the likely dispersion <strong>in</strong> the strength <strong>of</strong> this effect<br />
between clusters. Also, the question <strong>of</strong> background contam<strong>in</strong>ation is always<br />
an issue <strong>in</strong> the st<strong>and</strong>ard approach due to the <strong>in</strong>herent fluctuations <strong>in</strong> the surface<br />
density <strong>of</strong> background galaxies, <strong>and</strong> the need to establish the background<br />
counts at a sufficiently large radius from the cluster to avoid self-subtraction<br />
<strong>of</strong> the cluster at the boundaries <strong>of</strong> the data, a subject explored <strong>in</strong> depth, e.g.<br />
Adami et al. (2000); Paolillo et al. (2001); Andreon et al. (2005); Hansen<br />
55


