

Mass and Light distributions in Clusters of Galaxies - Henry A ...
Mass and Light distributions in Clusters of Galaxies - Henry A ...
Mass and Light distributions in Clusters of Galaxies - Henry A ...

You also want an ePaper? Increase the reach of your titles
YUMPU automatically turns print PDFs into web optimized ePapers that Google loves.
2.4 Distortion analysis <strong>of</strong> ACS/HST images<br />
0.8<br />
0.6<br />
0.4<br />
Distortion g +<br />
0.2<br />
0<br />
−0.2<br />
−0.4<br />
−0.6<br />
0.1 0.4 0.9 2 5 10 20<br />
θ [arcm<strong>in</strong>]<br />
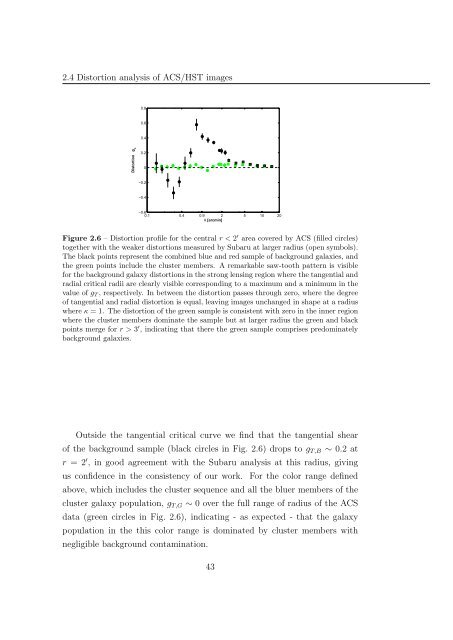
Figure 2.6 – Distortion pr<strong>of</strong>ile for the central r < 2 ′ area covered by ACS (filled circles)<br />
together with the weaker distortions measured by Subaru at larger radius (open symbols).<br />
The black po<strong>in</strong>ts represent the comb<strong>in</strong>ed blue <strong>and</strong> red sample <strong>of</strong> background galaxies, <strong>and</strong><br />
the green po<strong>in</strong>ts <strong>in</strong>clude the cluster members. A remarkable saw-tooth pattern is visible<br />
for the background galaxy distortions <strong>in</strong> the strong lens<strong>in</strong>g region where the tangential <strong>and</strong><br />
radial critical radii are clearly visible correspond<strong>in</strong>g to a maximum <strong>and</strong> a m<strong>in</strong>imum <strong>in</strong> the<br />
value <strong>of</strong> g T , respectively. In between the distortion passes through zero, where the degree<br />
<strong>of</strong> tangential <strong>and</strong> radial distortion is equal, leav<strong>in</strong>g images unchanged <strong>in</strong> shape at a radius<br />
where κ = 1. The distortion <strong>of</strong> the green sample is consistent with zero <strong>in</strong> the <strong>in</strong>ner region<br />
where the cluster members dom<strong>in</strong>ate the sample but at larger radius the green <strong>and</strong> black<br />
po<strong>in</strong>ts merge for r > 3 ′ , <strong>in</strong>dicat<strong>in</strong>g that there the green sample comprises predom<strong>in</strong>ately<br />
background galaxies.<br />
Outside the tangential critical curve we f<strong>in</strong>d that the tangential shear<br />
<strong>of</strong> the background sample (black circles <strong>in</strong> Fig. 2.6) drops to g T,B ∼ 0.2 at<br />
r = 2 ′ , <strong>in</strong> good agreement with the Subaru analysis at this radius, giv<strong>in</strong>g<br />
us confidence <strong>in</strong> the consistency <strong>of</strong> our work. For the color range def<strong>in</strong>ed<br />
above, which <strong>in</strong>cludes the cluster sequence <strong>and</strong> all the bluer members <strong>of</strong> the<br />
cluster galaxy population, g T,G ∼ 0 over the full range <strong>of</strong> radius <strong>of</strong> the ACS<br />
data (green circles <strong>in</strong> Fig. 2.6), <strong>in</strong>dicat<strong>in</strong>g - as expected - that the galaxy<br />
population <strong>in</strong> the this color range is dom<strong>in</strong>ated by cluster members with<br />
negligible background contam<strong>in</strong>ation.<br />
43


