

Mass and Light distributions in Clusters of Galaxies - Henry A ...
Mass and Light distributions in Clusters of Galaxies - Henry A ...
Mass and Light distributions in Clusters of Galaxies - Henry A ...

Create successful ePaper yourself
Turn your PDF publications into a flip-book with our unique Google optimized e-Paper software.
Weak Lens<strong>in</strong>g Dilution <strong>in</strong> A1689<br />
30<br />
28<br />
Radial critical curve<br />
κ=1 curve<br />
26<br />
24<br />
θ [arcsec]<br />
22<br />
20<br />
18<br />
16<br />
14<br />
12<br />
0 5 10 15 20 25 30<br />
C Vir<br />
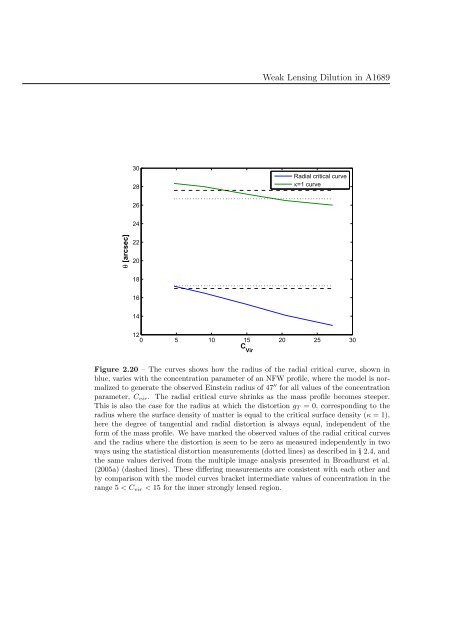
Figure 2.20 – The curves shows how the radius <strong>of</strong> the radial critical curve, shown <strong>in</strong><br />
blue, varies with the concentration parameter <strong>of</strong> an NFW pr<strong>of</strong>ile, where the model is normalized<br />
to generate the observed E<strong>in</strong>ste<strong>in</strong> radius <strong>of</strong> 47 ′′ for all values <strong>of</strong> the concentration<br />
parameter, C vir . The radial critical curve shr<strong>in</strong>ks as the mass pr<strong>of</strong>ile becomes steeper.<br />
This is also the case for the radius at which the distortion g T = 0, correspond<strong>in</strong>g to the<br />
radius where the surface density <strong>of</strong> matter is equal to the critical surface density (κ = 1),<br />
here the degree <strong>of</strong> tangential <strong>and</strong> radial distortion is always equal, <strong>in</strong>dependent <strong>of</strong> the<br />
form <strong>of</strong> the mass pr<strong>of</strong>ile. We have marked the observed values <strong>of</strong> the radial critical curves<br />
<strong>and</strong> the radius where the distortion is seen to be zero as measured <strong>in</strong>dependently <strong>in</strong> two<br />
ways us<strong>in</strong>g the statistical distortion measurements (dotted l<strong>in</strong>es) as described <strong>in</strong> § 2.4, <strong>and</strong><br />
the same values derived from the multiple image analysis presented <strong>in</strong> Broadhurst et al.<br />
(2005a) (dashed l<strong>in</strong>es). These differ<strong>in</strong>g measurements are consistent with each other <strong>and</strong><br />
by comparison with the model curves bracket <strong>in</strong>termediate values <strong>of</strong> concentration <strong>in</strong> the<br />
range 5 < C vir < 15 for the <strong>in</strong>ner strongly lensed region.


