Mass and Light distributions in Clusters of Galaxies - Henry A ...
Mass and Light distributions in Clusters of Galaxies - Henry A ...
Mass and Light distributions in Clusters of Galaxies - Henry A ...
You also want an ePaper? Increase the reach of your titles
YUMPU automatically turns print PDFs into web optimized ePapers that Google loves.
3.3 Sample selection from the color-color diagram<br />
3.3 Sample selection from the color-color diagram<br />
For each cluster we use Subaru observations <strong>in</strong> three broad-b<strong>and</strong>s, which differ<br />
<strong>in</strong> their choice <strong>of</strong> passb<strong>and</strong>s between the clusters, though all observations<br />
are deep <strong>and</strong> taken <strong>in</strong> conditions <strong>of</strong> good see<strong>in</strong>g, represent<strong>in</strong>g some <strong>of</strong> the<br />
highest quality imag<strong>in</strong>g <strong>of</strong> any target by Subaru <strong>in</strong> terms <strong>of</strong> depth, resolution,<br />
<strong>and</strong> color coverage. Us<strong>in</strong>g three b<strong>and</strong>s <strong>in</strong> terms <strong>of</strong> two-color space for<br />
object selection will help separate different populations <strong>and</strong> improve subsequent<br />
WL <strong>and</strong> light measurements <strong>of</strong> the cluster, as we now demonstrate.<br />
3.3.1 Cluster Members<br />
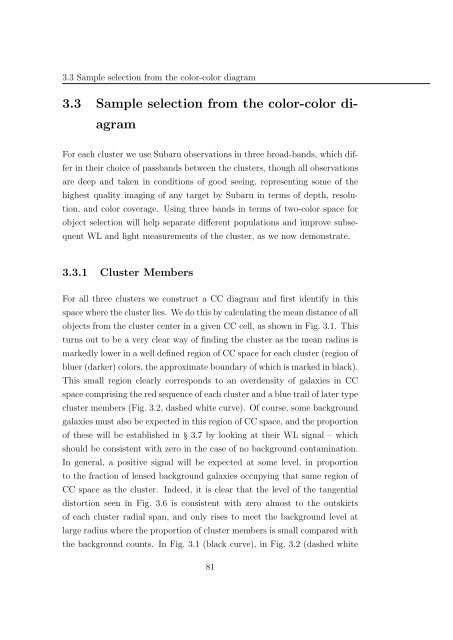
For all three clusters we construct a CC diagram <strong>and</strong> first identify <strong>in</strong> this<br />
space where the cluster lies. We do this by calculat<strong>in</strong>g the mean distance <strong>of</strong> all<br />
objects from the cluster center <strong>in</strong> a given CC cell, as shown <strong>in</strong> Fig. 3.1. This<br />
turns out to be a very clear way <strong>of</strong> f<strong>in</strong>d<strong>in</strong>g the cluster as the mean radius is<br />
markedly lower <strong>in</strong> a well def<strong>in</strong>ed region <strong>of</strong> CC space for each cluster (region <strong>of</strong><br />
bluer (darker) colors, the approximate boundary <strong>of</strong> which is marked <strong>in</strong> black).<br />
This small region clearly corresponds to an overdensity <strong>of</strong> galaxies <strong>in</strong> CC<br />
space compris<strong>in</strong>g the red sequence <strong>of</strong> each cluster <strong>and</strong> a blue trail <strong>of</strong> later type<br />
cluster members (Fig. 3.2, dashed white curve). Of course, some background<br />
galaxies must also be expected <strong>in</strong> this region <strong>of</strong> CC space, <strong>and</strong> the proportion<br />
<strong>of</strong> these will be established <strong>in</strong> § 3.7 by look<strong>in</strong>g at their WL signal – which<br />
should be consistent with zero <strong>in</strong> the case <strong>of</strong> no background contam<strong>in</strong>ation.<br />
In general, a positive signal will be expected at some level, <strong>in</strong> proportion<br />
to the fraction <strong>of</strong> lensed background galaxies occupy<strong>in</strong>g that same region <strong>of</strong><br />
CC space as the cluster. Indeed, it is clear that the level <strong>of</strong> the tangential<br />
distortion seen <strong>in</strong> Fig. 3.6 is consistent with zero almost to the outskirts<br />
<strong>of</strong> each cluster radial span, <strong>and</strong> only rises to meet the background level at<br />
large radius where the proportion <strong>of</strong> cluster members is small compared with<br />
the background counts. In Fig. 3.1 (black curve), <strong>in</strong> Fig. 3.2 (dashed white<br />
81


