

Mass and Light distributions in Clusters of Galaxies - Henry A ...
Mass and Light distributions in Clusters of Galaxies - Henry A ...
Mass and Light distributions in Clusters of Galaxies - Henry A ...

You also want an ePaper? Increase the reach of your titles
YUMPU automatically turns print PDFs into web optimized ePapers that Google loves.
<strong>Mass</strong> <strong>and</strong> <strong>Light</strong> <strong>of</strong> A1703, A370 & RXJ1347-11<br />
1.5<br />
0.25<br />
Distortion g +<br />
0.2<br />
0.15<br />
0.1<br />
0.05<br />
0<br />
−0.05 0.2<br />
Fraction 1−g +<br />
(G)/g +<br />
(B)<br />
1<br />
0.5<br />
0<br />
g x<br />
0<br />
−0.2<br />
1 2 5 10 20<br />
θ [arcm<strong>in</strong>]<br />
−0.5<br />
1 2 5 10 20<br />
θ [arcm<strong>in</strong>]<br />
0.8<br />
1.5<br />
0.7<br />
0.6<br />
Distortion g +<br />
0.5<br />
0.4<br />
0.3<br />
0.2<br />
0.1<br />
0<br />
0.2<br />
Fraction 1−g +<br />
(G)/g +<br />
(B)<br />
1<br />
0.5<br />
0<br />
g x<br />
0<br />
−0.2<br />
1 2 5 10 20<br />
θ [arcm<strong>in</strong>]<br />
−0.5<br />
1 2 5 10 20<br />
θ [arcm<strong>in</strong>]<br />
1.5<br />
0.5<br />
Distortion g +<br />
0.4<br />
0.3<br />
0.2<br />
0.1<br />
0<br />
−0.1 0.2<br />
Fraction 1−g +<br />
(G)/g +<br />
(B)<br />
1<br />
0.5<br />
0<br />
g x<br />
0<br />
−0.2<br />
1 2 5 10 20<br />
θ [arcm<strong>in</strong>]<br />
−0.5<br />
1 2 5 10 20<br />
θ [arcm<strong>in</strong>]<br />
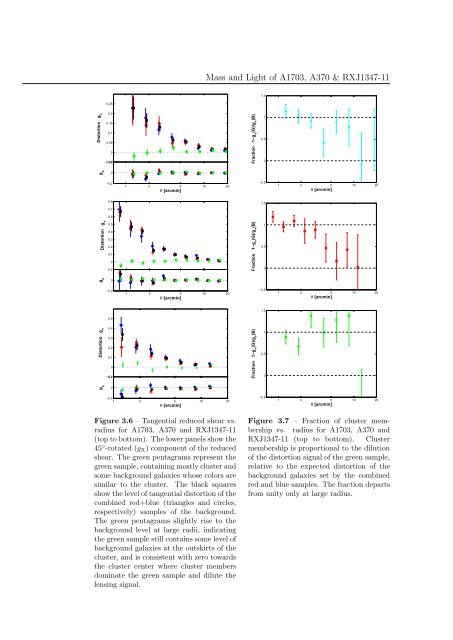
Figure 3.6 – Tangential reduced shear vs.<br />
radius for A1703, A370 <strong>and</strong> RXJ1347-11<br />
(top to bottom). The lower panels show the<br />
45 ◦ -rotated (g X ) component <strong>of</strong> the reduced<br />
shear. The green pentagrams represent the<br />
green sample, conta<strong>in</strong><strong>in</strong>g mostly cluster <strong>and</strong><br />
some background galaxies whose colors are<br />
similar to the cluster. The black squares<br />
show the level <strong>of</strong> tangential distortion <strong>of</strong> the<br />
comb<strong>in</strong>ed red+blue (triangles <strong>and</strong> circles,<br />
respectively) samples <strong>of</strong> the background.<br />
The green pentagrams slightly rise to the<br />
background level at large radii, <strong>in</strong>dicat<strong>in</strong>g<br />
the green sample still conta<strong>in</strong>s some level <strong>of</strong><br />
background galaxies at the outskirts <strong>of</strong> the<br />
cluster, <strong>and</strong> is consistent with zero towards<br />
the cluster center where cluster members<br />
dom<strong>in</strong>ate the green sample <strong>and</strong> dilute the<br />
lens<strong>in</strong>g signal.<br />
Figure 3.7 – Fraction <strong>of</strong> cluster membership<br />
vs. radius for A1703, A370 <strong>and</strong><br />
RXJ1347-11 (top to bottom). Cluster<br />
membership is proportional to the dilution<br />
<strong>of</strong> the distortion signal <strong>of</strong> the green sample,<br />
relative to the expected distortion <strong>of</strong> the<br />
background galaxies set by the comb<strong>in</strong>ed<br />
red <strong>and</strong> blue samples. The fraction departs<br />
from unity only at large radius.


