

Mass and Light distributions in Clusters of Galaxies - Henry A ...
Mass and Light distributions in Clusters of Galaxies - Henry A ...
Mass and Light distributions in Clusters of Galaxies - Henry A ...

Create successful ePaper yourself
Turn your PDF publications into a flip-book with our unique Google optimized e-Paper software.
2.8 Cluster lum<strong>in</strong>osity functions<br />
10 15 θ [arcm<strong>in</strong>]<br />
Lum<strong>in</strong>osity density [L iο<br />
h 2 Mpc −2 ]<br />
10 14<br />
10 13<br />
10 12<br />
Lum<strong>in</strong>osity density [L i’ο<br />
h 2 Mpc −2 ]<br />
10 11<br />
0.1 0.4 0.9 2 5 10 20<br />
10 12 1 2 5 10 20<br />
θ [arcm<strong>in</strong>]<br />
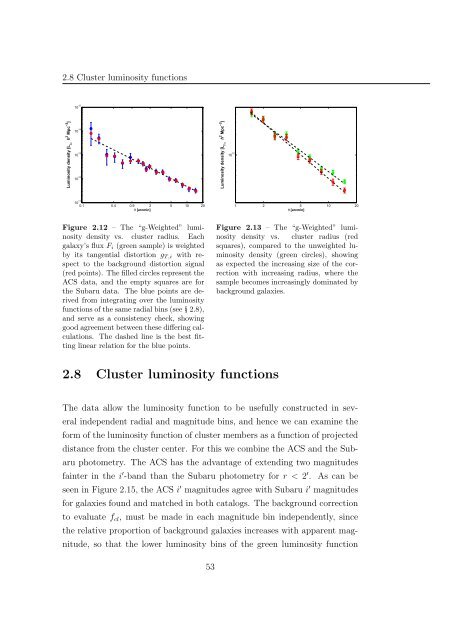
Figure 2.12 – The “g-Weighted” lum<strong>in</strong>osity<br />
density vs. cluster radius. Each<br />
galaxy’s flux F i (green sample) is weighted<br />
by its tangential distortion g T,i with respect<br />
to the background distortion signal<br />
(red po<strong>in</strong>ts). The filled circles represent the<br />
ACS data, <strong>and</strong> the empty squares are for<br />
the Subaru data. The blue po<strong>in</strong>ts are derived<br />
from <strong>in</strong>tegrat<strong>in</strong>g over the lum<strong>in</strong>osity<br />
functions <strong>of</strong> the same radial b<strong>in</strong>s (see § 2.8),<br />
<strong>and</strong> serve as a consistency check, show<strong>in</strong>g<br />
good agreement between these differ<strong>in</strong>g calculations.<br />
The dashed l<strong>in</strong>e is the best fitt<strong>in</strong>g<br />
l<strong>in</strong>ear relation for the blue po<strong>in</strong>ts.<br />
Figure 2.13 – The “g-Weighted” lum<strong>in</strong>osity<br />
density vs. cluster radius (red<br />
squares), compared to the unweighted lum<strong>in</strong>osity<br />
density (green circles), show<strong>in</strong>g<br />
as expected the <strong>in</strong>creas<strong>in</strong>g size <strong>of</strong> the correction<br />
with <strong>in</strong>creas<strong>in</strong>g radius, where the<br />
sample becomes <strong>in</strong>creas<strong>in</strong>gly dom<strong>in</strong>ated by<br />
background galaxies.<br />
2.8 Cluster lum<strong>in</strong>osity functions<br />
The data allow the lum<strong>in</strong>osity function to be usefully constructed <strong>in</strong> several<br />
<strong>in</strong>dependent radial <strong>and</strong> magnitude b<strong>in</strong>s, <strong>and</strong> hence we can exam<strong>in</strong>e the<br />
form <strong>of</strong> the lum<strong>in</strong>osity function <strong>of</strong> cluster members as a function <strong>of</strong> projected<br />
distance from the cluster center. For this we comb<strong>in</strong>e the ACS <strong>and</strong> the Subaru<br />
photometry. The ACS has the advantage <strong>of</strong> extend<strong>in</strong>g two magnitudes<br />
fa<strong>in</strong>ter <strong>in</strong> the i ′ -b<strong>and</strong> than the Subaru photometry for r < 2 ′ . As can be<br />
seen <strong>in</strong> Figure 2.15, the ACS i ′ magnitudes agree with Subaru i ′ magnitudes<br />
for galaxies found <strong>and</strong> matched <strong>in</strong> both catalogs. The background correction<br />
to evaluate f cl , must be made <strong>in</strong> each magnitude b<strong>in</strong> <strong>in</strong>dependently, s<strong>in</strong>ce<br />
the relative proportion <strong>of</strong> background galaxies <strong>in</strong>creases with apparent magnitude,<br />
so that the lower lum<strong>in</strong>osity b<strong>in</strong>s <strong>of</strong> the green lum<strong>in</strong>osity function<br />
53


