

Mass and Light distributions in Clusters of Galaxies - Henry A ...
Mass and Light distributions in Clusters of Galaxies - Henry A ...
Mass and Light distributions in Clusters of Galaxies - Henry A ...

Create successful ePaper yourself
Turn your PDF publications into a flip-book with our unique Google optimized e-Paper software.
Weak Lens<strong>in</strong>g Dilution <strong>in</strong> A1689<br />
0.5<br />
0.5<br />
0.2<br />
0.2<br />
Distortion g +<br />
0.1<br />
Distortion g +<br />
0.1<br />
0.02<br />
0.02<br />
0.01<br />
0.01<br />
2 5 10 20<br />
θ [arcm<strong>in</strong>]<br />
2 5 10 20<br />
θ [arcm<strong>in</strong>]<br />
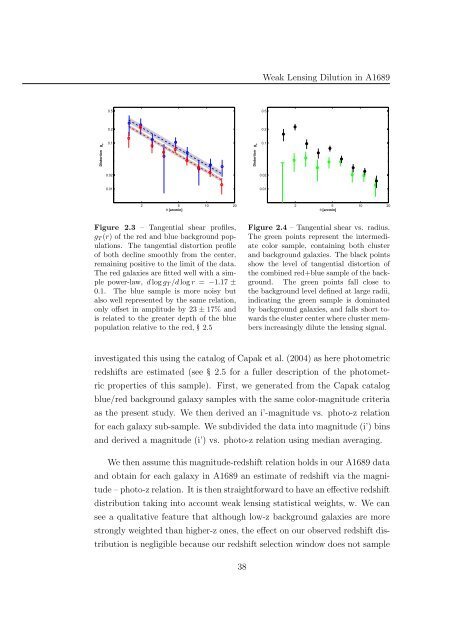
Figure 2.3 – Tangential shear pr<strong>of</strong>iles,<br />
g T (r) <strong>of</strong> the red <strong>and</strong> blue background populations.<br />
The tangential distortion pr<strong>of</strong>ile<br />
<strong>of</strong> both decl<strong>in</strong>e smoothly from the center,<br />
rema<strong>in</strong><strong>in</strong>g positive to the limit <strong>of</strong> the data.<br />
The red galaxies are fitted well with a simple<br />
power-law, d log g T /d log r = −1.17 ±<br />
0.1. The blue sample is more noisy but<br />
also well represented by the same relation,<br />
only <strong>of</strong>fset <strong>in</strong> amplitude by 23 ± 17% <strong>and</strong><br />
is related to the greater depth <strong>of</strong> the blue<br />
population relative to the red, § 2.5<br />
Figure 2.4 – Tangential shear vs. radius.<br />
The green po<strong>in</strong>ts represent the <strong>in</strong>termediate<br />
color sample, conta<strong>in</strong><strong>in</strong>g both cluster<br />
<strong>and</strong> background galaxies. The black po<strong>in</strong>ts<br />
show the level <strong>of</strong> tangential distortion <strong>of</strong><br />
the comb<strong>in</strong>ed red+blue sample <strong>of</strong> the background.<br />
The green po<strong>in</strong>ts fall close to<br />
the background level def<strong>in</strong>ed at large radii,<br />
<strong>in</strong>dicat<strong>in</strong>g the green sample is dom<strong>in</strong>ated<br />
by background galaxies, <strong>and</strong> falls short towards<br />
the cluster center where cluster members<br />
<strong>in</strong>creas<strong>in</strong>gly dilute the lens<strong>in</strong>g signal.<br />
<strong>in</strong>vestigated this us<strong>in</strong>g the catalog <strong>of</strong> Capak et al. (2004) as here photometric<br />
redshifts are estimated (see § 2.5 for a fuller description <strong>of</strong> the photometric<br />
properties <strong>of</strong> this sample). First, we generated from the Capak catalog<br />
blue/red background galaxy samples with the same color-magnitude criteria<br />
as the present study. We then derived an i’-magnitude vs. photo-z relation<br />
for each galaxy sub-sample. We subdivided the data <strong>in</strong>to magnitude (i’) b<strong>in</strong>s<br />
<strong>and</strong> derived a magnitude (i’) vs. photo-z relation us<strong>in</strong>g median averag<strong>in</strong>g.<br />
We then assume this magnitude-redshift relation holds <strong>in</strong> our A1689 data<br />
<strong>and</strong> obta<strong>in</strong> for each galaxy <strong>in</strong> A1689 an estimate <strong>of</strong> redshift via the magnitude<br />
– photo-z relation. It is then straightforward to have an effective redshift<br />
distribution tak<strong>in</strong>g <strong>in</strong>to account weak lens<strong>in</strong>g statistical weights, w. We can<br />
see a qualitative feature that although low-z background galaxies are more<br />
strongly weighted than higher-z ones, the effect on our observed redshift distribution<br />
is negligible because our redshift selection w<strong>in</strong>dow does not sample<br />
38


