

Mass and Light distributions in Clusters of Galaxies - Henry A ...
Mass and Light distributions in Clusters of Galaxies - Henry A ...
Mass and Light distributions in Clusters of Galaxies - Henry A ...

You also want an ePaper? Increase the reach of your titles
YUMPU automatically turns print PDFs into web optimized ePapers that Google loves.
Weak Lens<strong>in</strong>g Dilution <strong>in</strong> A1689<br />
0.86<br />
0.84<br />
0.82<br />
Cluster V−i [mag]<br />
0.8<br />
0.78<br />
0.76<br />
0.74<br />
0.72<br />
0.7<br />
0.68<br />
0.66<br />
0.9 2 5 10 20<br />
θ [arcm<strong>in</strong>]<br />
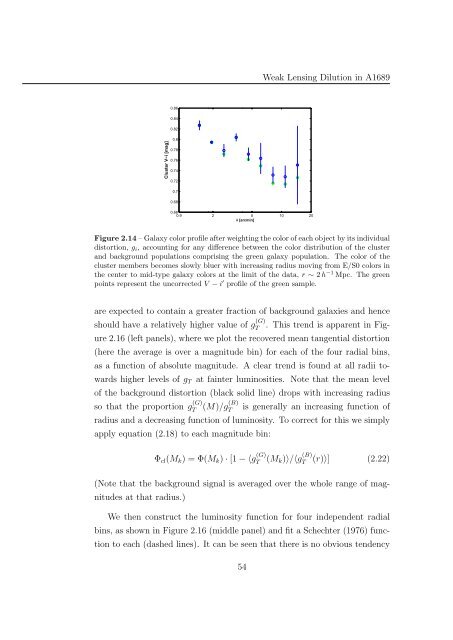
Figure 2.14 – Galaxy color pr<strong>of</strong>ile after weight<strong>in</strong>g the color <strong>of</strong> each object by its <strong>in</strong>dividual<br />
distortion, g i , account<strong>in</strong>g for any difference between the color distribution <strong>of</strong> the cluster<br />
<strong>and</strong> background populations compris<strong>in</strong>g the green galaxy population. The color <strong>of</strong> the<br />
cluster members becomes slowly bluer with <strong>in</strong>creas<strong>in</strong>g radius mov<strong>in</strong>g from E/S0 colors <strong>in</strong><br />
the center to mid-type galaxy colors at the limit <strong>of</strong> the data, r ∼ 2 h −1 Mpc. The green<br />
po<strong>in</strong>ts represent the uncorrected V − i ′ pr<strong>of</strong>ile <strong>of</strong> the green sample.<br />
are expected to conta<strong>in</strong> a greater fraction <strong>of</strong> background galaxies <strong>and</strong> hence<br />
should have a relatively higher value <strong>of</strong> g (G)<br />
T<br />
. This trend is apparent <strong>in</strong> Figure<br />
2.16 (left panels), where we plot the recovered mean tangential distortion<br />
(here the average is over a magnitude b<strong>in</strong>) for each <strong>of</strong> the four radial b<strong>in</strong>s,<br />
as a function <strong>of</strong> absolute magnitude. A clear trend is found at all radii towards<br />
higher levels <strong>of</strong> g T at fa<strong>in</strong>ter lum<strong>in</strong>osities. Note that the mean level<br />
<strong>of</strong> the background distortion (black solid l<strong>in</strong>e) drops with <strong>in</strong>creas<strong>in</strong>g radius<br />
so that the proportion g (G)<br />
T<br />
(M)/g(B) T<br />
is generally an <strong>in</strong>creas<strong>in</strong>g function <strong>of</strong><br />
radius <strong>and</strong> a decreas<strong>in</strong>g function <strong>of</strong> lum<strong>in</strong>osity. To correct for this we simply<br />
apply equation (2.18) to each magnitude b<strong>in</strong>:<br />
Φ cl (M k ) = Φ(M k ) · [1 − 〈g (G)<br />
T<br />
(M k)〉/〈g (B)<br />
T<br />
(r)〉] (2.22)<br />
(Note that the background signal is averaged over the whole range <strong>of</strong> magnitudes<br />
at that radius.)<br />
We then construct the lum<strong>in</strong>osity function for four <strong>in</strong>dependent radial<br />
b<strong>in</strong>s, as shown <strong>in</strong> Figure 2.16 (middle panel) <strong>and</strong> fit a Schechter (1976) function<br />
to each (dashed l<strong>in</strong>es). It can be seen that there is no obvious tendency<br />
54


