

Mass and Light distributions in Clusters of Galaxies - Henry A ...
Mass and Light distributions in Clusters of Galaxies - Henry A ...
Mass and Light distributions in Clusters of Galaxies - Henry A ...

You also want an ePaper? Increase the reach of your titles
YUMPU automatically turns print PDFs into web optimized ePapers that Google loves.
2.6 Weak lens<strong>in</strong>g dilution<br />
0.06<br />
0.04<br />
0.02<br />
Distortion g +<br />
0<br />
−0.02<br />
−0.04<br />
−0.06<br />
2 5 10 20<br />
θ [arcm<strong>in</strong>]<br />
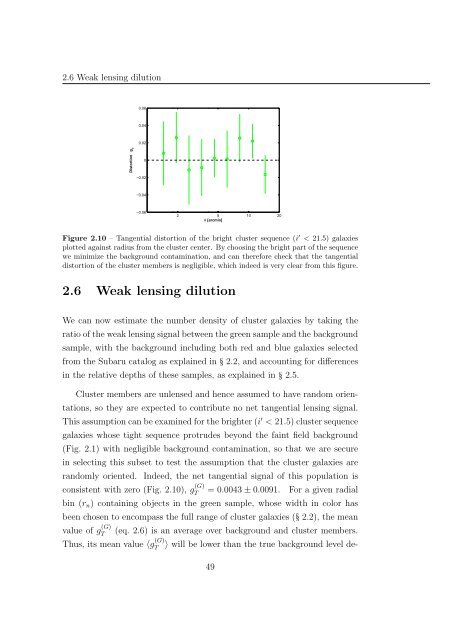
Figure 2.10 – Tangential distortion <strong>of</strong> the bright cluster sequence (i ′ < 21.5) galaxies<br />
plotted aga<strong>in</strong>st radius from the cluster center. By choos<strong>in</strong>g the bright part <strong>of</strong> the sequence<br />
we m<strong>in</strong>imize the background contam<strong>in</strong>ation, <strong>and</strong> can therefore check that the tangential<br />
distortion <strong>of</strong> the cluster members is negligible, which <strong>in</strong>deed is very clear from this figure.<br />
2.6 Weak lens<strong>in</strong>g dilution<br />
We can now estimate the number density <strong>of</strong> cluster galaxies by tak<strong>in</strong>g the<br />
ratio <strong>of</strong> the weak lens<strong>in</strong>g signal between the green sample <strong>and</strong> the background<br />
sample, with the background <strong>in</strong>clud<strong>in</strong>g both red <strong>and</strong> blue galaxies selected<br />
from the Subaru catalog as expla<strong>in</strong>ed <strong>in</strong> § 2.2, <strong>and</strong> account<strong>in</strong>g for differences<br />
<strong>in</strong> the relative depths <strong>of</strong> these samples, as expla<strong>in</strong>ed <strong>in</strong> § 2.5.<br />
Cluster members are unlensed <strong>and</strong> hence assumed to have r<strong>and</strong>om orientations,<br />
so they are expected to contribute no net tangential lens<strong>in</strong>g signal.<br />
This assumption can be exam<strong>in</strong>ed for the brighter (i ′ < 21.5) cluster sequence<br />
galaxies whose tight sequence protrudes beyond the fa<strong>in</strong>t field background<br />
(Fig. 2.1) with negligible background contam<strong>in</strong>ation, so that we are secure<br />
<strong>in</strong> select<strong>in</strong>g this subset to test the assumption that the cluster galaxies are<br />
r<strong>and</strong>omly oriented. Indeed, the net tangential signal <strong>of</strong> this population is<br />
consistent with zero (Fig. 2.10), g (G)<br />
T<br />
= 0.0043 ± 0.0091. For a given radial<br />
b<strong>in</strong> (r n ) conta<strong>in</strong><strong>in</strong>g objects <strong>in</strong> the green sample, whose width <strong>in</strong> color has<br />
been chosen to encompass the full range <strong>of</strong> cluster galaxies (§ 2.2), the mean<br />
value <strong>of</strong> g (G)<br />
T<br />
(eq. 2.6) is an average over background <strong>and</strong> cluster members.<br />
Thus, its mean value 〈g (G) 〉 will be lower than the true background level de-<br />
T<br />
49


