

Mass and Light distributions in Clusters of Galaxies - Henry A ...
Mass and Light distributions in Clusters of Galaxies - Henry A ...
Mass and Light distributions in Clusters of Galaxies - Henry A ...

Create successful ePaper yourself
Turn your PDF publications into a flip-book with our unique Google optimized e-Paper software.
4.3 Sample selection from the color-color diagram<br />
x 10 −6<br />
7<br />
3<br />
6<br />
2.5<br />
5<br />
B − R<br />
2<br />
1.5<br />
4<br />
3<br />
Number/pix 2<br />
1<br />
2<br />
0.5<br />
1<br />
0<br />
0 0.5 1 1.5<br />
R − Z<br />
0<br />
3.5<br />
3.5<br />
3<br />
E−type<br />
3<br />
2.5<br />
2.5<br />
B − R<br />
2<br />
1.5<br />
2<br />
1.5<br />
redshift<br />
1<br />
S0<br />
0.5<br />
Sa<br />
Sd<br />
0<br />
−0.5 0 0.5 1 1.5 2<br />
R − Z<br />
1<br />
0.5<br />
0<br />
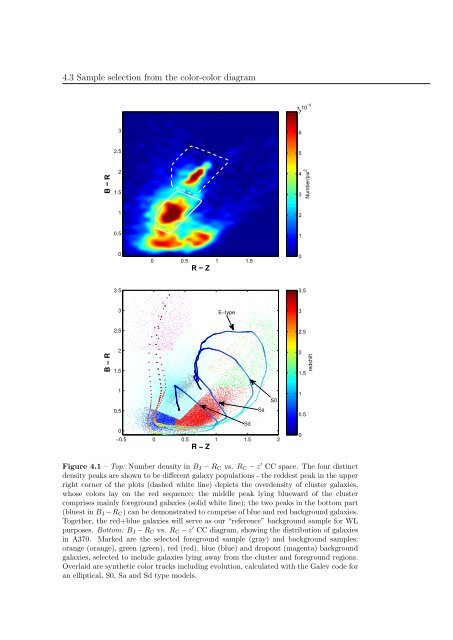
Figure 4.1 – Top: Number density <strong>in</strong> B J − R C vs. R C − z ′ CC space. The four dist<strong>in</strong>ct<br />
density peaks are shown to be different galaxy populations - the reddest peak <strong>in</strong> the upper<br />
right corner <strong>of</strong> the plots (dashed white l<strong>in</strong>e) depicts the overdensity <strong>of</strong> cluster galaxies,<br />
whose colors lay on the red sequence; the middle peak ly<strong>in</strong>g blueward <strong>of</strong> the cluster<br />
comprises ma<strong>in</strong>ly foreground galaxies (solid white l<strong>in</strong>e); the two peaks <strong>in</strong> the bottom part<br />
(bluest <strong>in</strong> B J −R C ) can be demonstrated to comprise <strong>of</strong> blue <strong>and</strong> red background galaxies.<br />
Together, the red+blue galaxies will serve as our “reference” background sample for WL<br />
purposes. Bottom: B J − R C vs. R C − z ′ CC diagram, show<strong>in</strong>g the distribution <strong>of</strong> galaxies<br />
<strong>in</strong> A370. Marked are the selected foreground sample (gray) <strong>and</strong> background samples:<br />
orange (orange), green (green), red (red), blue (blue) <strong>and</strong> dropout (magenta) background<br />
galaxies, selected to <strong>in</strong>clude galaxies ly<strong>in</strong>g away from the cluster <strong>and</strong> foreground regions.<br />
Overlaid are synthetic color tracks <strong>in</strong>clud<strong>in</strong>g evolution, calculated with the Galev code for<br />
an elliptical, S0, Sa <strong>and</strong> Sd type models.


