

Mass and Light distributions in Clusters of Galaxies - Henry A ...
Mass and Light distributions in Clusters of Galaxies - Henry A ...
Mass and Light distributions in Clusters of Galaxies - Henry A ...

You also want an ePaper? Increase the reach of your titles
YUMPU automatically turns print PDFs into web optimized ePapers that Google loves.
2.4 Distortion analysis <strong>of</strong> ACS/HST images<br />
3.5<br />
3<br />
2.5<br />
2<br />
g’−i’<br />
1.5<br />
1<br />
0.5<br />
0<br />
−0.5<br />
−1<br />
16 18 20 22 24 26 28<br />
i’ AB<br />
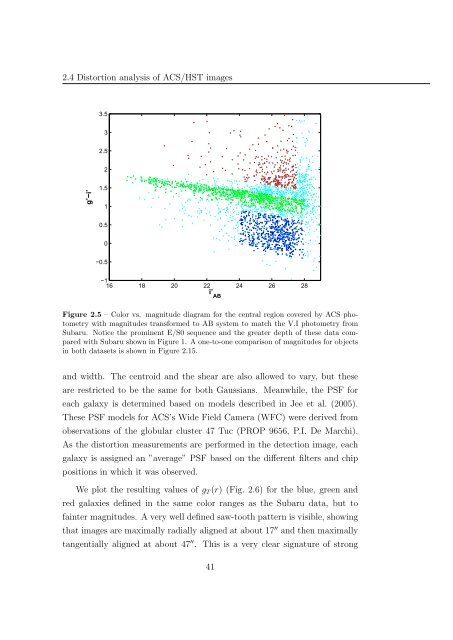
Figure 2.5 – Color vs. magnitude diagram for the central region covered by ACS photometry<br />
with magnitudes transformed to AB system to match the V,I photometry from<br />
Subaru. Notice the prom<strong>in</strong>ent E/S0 sequence <strong>and</strong> the greater depth <strong>of</strong> these data compared<br />
with Subaru shown <strong>in</strong> Figure 1. A one-to-one comparison <strong>of</strong> magnitudes for objects<br />
<strong>in</strong> both datasets is shown <strong>in</strong> Figure 2.15.<br />
<strong>and</strong> width. The centroid <strong>and</strong> the shear are also allowed to vary, but these<br />
are restricted to be the same for both Gaussians. Meanwhile, the PSF for<br />
each galaxy is determ<strong>in</strong>ed based on models described <strong>in</strong> Jee et al. (2005).<br />
These PSF models for ACS’s Wide Field Camera (WFC) were derived from<br />
observations <strong>of</strong> the globular cluster 47 Tuc (PROP 9656, P.I. De Marchi).<br />
As the distortion measurements are performed <strong>in</strong> the detection image, each<br />
galaxy is assigned an ”average” PSF based on the different filters <strong>and</strong> chip<br />
positions <strong>in</strong> which it was observed.<br />
We plot the result<strong>in</strong>g values <strong>of</strong> g T (r) (Fig. 2.6) for the blue, green <strong>and</strong><br />
red galaxies def<strong>in</strong>ed <strong>in</strong> the same color ranges as the Subaru data, but to<br />
fa<strong>in</strong>ter magnitudes. A very well def<strong>in</strong>ed saw-tooth pattern is visible, show<strong>in</strong>g<br />
that images are maximally radially aligned at about 17 ′′ <strong>and</strong> then maximally<br />
tangentially aligned at about 47 ′′ . This is a very clear signature <strong>of</strong> strong<br />
41


