Mass and Light distributions in Clusters of Galaxies - Henry A ...
Mass and Light distributions in Clusters of Galaxies - Henry A ...
Mass and Light distributions in Clusters of Galaxies - Henry A ...
You also want an ePaper? Increase the reach of your titles
YUMPU automatically turns print PDFs into web optimized ePapers that Google loves.
<strong>Mass</strong> <strong>and</strong> <strong>Light</strong> <strong>of</strong> A1703, A370 & RXJ1347-11<br />
our CC selection.<br />
3.7 Weak lens<strong>in</strong>g dilution<br />
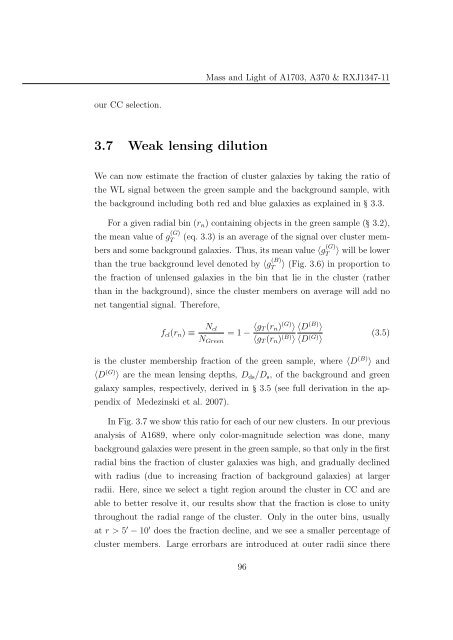
We can now estimate the fraction <strong>of</strong> cluster galaxies by tak<strong>in</strong>g the ratio <strong>of</strong><br />
the WL signal between the green sample <strong>and</strong> the background sample, with<br />
the background <strong>in</strong>clud<strong>in</strong>g both red <strong>and</strong> blue galaxies as expla<strong>in</strong>ed <strong>in</strong> § 3.3.<br />
For a given radial b<strong>in</strong> (r n ) conta<strong>in</strong><strong>in</strong>g objects <strong>in</strong> the green sample (§ 3.2),<br />
the mean value <strong>of</strong> g (G)<br />
T<br />
(eq. 3.3) is an average <strong>of</strong> the signal over cluster members<br />
<strong>and</strong> some background galaxies. Thus, its mean value 〈g (G)<br />
T<br />
〉 will be lower<br />
than the true background level denoted by 〈g (B) 〉 (Fig. 3.6) <strong>in</strong> proportion to<br />
T<br />
the fraction <strong>of</strong> unlensed galaxies <strong>in</strong> the b<strong>in</strong> that lie <strong>in</strong> the cluster (rather<br />
than <strong>in</strong> the background), s<strong>in</strong>ce the cluster members on average will add no<br />
net tangential signal. Therefore,<br />
f cl (r n ) ≡<br />
N cl<br />
= 1 − 〈g T (r n ) (G) 〉<br />
N Green 〈g T (r n ) (B) 〉<br />
〈D (B) 〉<br />
〈D (G) 〉<br />
(3.5)<br />
is the cluster membership fraction <strong>of</strong> the green sample, where 〈D (B) 〉 <strong>and</strong><br />
〈D (G) 〉 are the mean lens<strong>in</strong>g depths, D ds /D s , <strong>of</strong> the background <strong>and</strong> green<br />
galaxy samples, respectively, derived <strong>in</strong> § 3.5 (see full derivation <strong>in</strong> the appendix<br />
<strong>of</strong> Medez<strong>in</strong>ski et al. 2007).<br />
In Fig. 3.7 we show this ratio for each <strong>of</strong> our new clusters. In our previous<br />
analysis <strong>of</strong> A1689, where only color-magnitude selection was done, many<br />
background galaxies were present <strong>in</strong> the green sample, so that only <strong>in</strong> the first<br />
radial b<strong>in</strong>s the fraction <strong>of</strong> cluster galaxies was high, <strong>and</strong> gradually decl<strong>in</strong>ed<br />
with radius (due to <strong>in</strong>creas<strong>in</strong>g fraction <strong>of</strong> background galaxies) at larger<br />
radii. Here, s<strong>in</strong>ce we select a tight region around the cluster <strong>in</strong> CC <strong>and</strong> are<br />
able to better resolve it, our results show that the fraction is close to unity<br />
throughout the radial range <strong>of</strong> the cluster. Only <strong>in</strong> the outer b<strong>in</strong>s, usually<br />
at r > 5 ′ − 10 ′ does the fraction decl<strong>in</strong>e, <strong>and</strong> we see a smaller percentage <strong>of</strong><br />
cluster members. Large errorbars are <strong>in</strong>troduced at outer radii s<strong>in</strong>ce there<br />
96


