10 - H1 - Desy
10 - H1 - Desy
10 - H1 - Desy

Create successful ePaper yourself
Turn your PDF publications into a flip-book with our unique Google optimized e-Paper software.
76 Photon signal extraction<br />
Events<br />
4000<br />
3000<br />
2000<br />
<strong>10</strong>00<br />
Events<br />
3000<br />
2000<br />
<strong>10</strong>00<br />
Events<br />
4000<br />
3000<br />
2000<br />
<strong>10</strong>00<br />
<strong>H1</strong> HERA II<br />
Sum<br />
Signal<br />
Background<br />
0<br />
2 4 6<br />
Transverse Radius [cm]<br />
0<br />
0.5 1<br />
Transverse Symmetry<br />
0<br />
0 5 <strong>10</strong> 15<br />
Kurtosis<br />
Events<br />
3000<br />
Events<br />
6000<br />
Events<br />
3000<br />
2000<br />
4000<br />
2000<br />
<strong>10</strong>00<br />
2000<br />
<strong>10</strong>00<br />
0<br />
0 0.2 0.4 0.6<br />
First Layer Fraction<br />
0<br />
0.4 0.6 0.8 1<br />
Hot Core Fraction<br />
0<br />
0 0.5 1<br />
Hottest Cell Fraction<br />
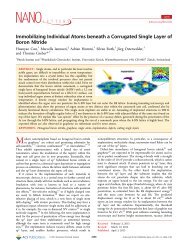
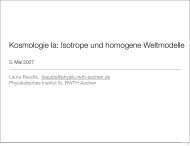
Figure 6.2: Shower shape variables used to discriminate between signal and background<br />
clusters. Data is compared to the sum of MC predictions (shadowed gray) as well as<br />
signal (solid red) and background (dashed blue) distributions.<br />
that variable has the scale comparable to the granularity itself 1 . Taking into account both<br />
effects, all variables have been studied in bins of transverse energy E T and pseudorapidity<br />
η, where pseudorapidity bins correspond to wheels of LAr calorimeter. In figures 6.3 and<br />
6.4 this study is presented for two of the shower shapes: R T and FLF. The binning<br />
used for these plots is consistently used in the following multivariate analysis (MVA)<br />
throughout all this chapter and is summarised in appendix table A-1.<br />
Studying the transverse radius distributions, presented in the figure 6.3 one can note the<br />
influence of the wheel granulity. Particularly, the R T distribution is wider in the CB1<br />
and CB2 wheels, where LAr calorimeter granularity is the poorest. One can observe the<br />
weaking of the discriminating power with the rise of energy of studied particles. Similar<br />
effect can be noted for FLF distributions (figure 6.4), which variations in η is reflected<br />
in its sensitivity to the technical details of the LAr calorimeter geometry. Particularly<br />
FB2 wheel, with different absorber material in the first layer produces lower FLF values<br />
in comparison to other wheels. Since the photon conversion probability has only a weak<br />
energy dependence, the shapes of FLF do not vary between transverse energy bins.<br />
1 As indeed is the case in presented analysis.