

Transportation Spending by Low-Income California Households ...
Transportation Spending by Low-Income California Households ...
Transportation Spending by Low-Income California Households ...

You also want an ePaper? Increase the reach of your titles
YUMPU automatically turns print PDFs into web optimized ePapers that Google loves.
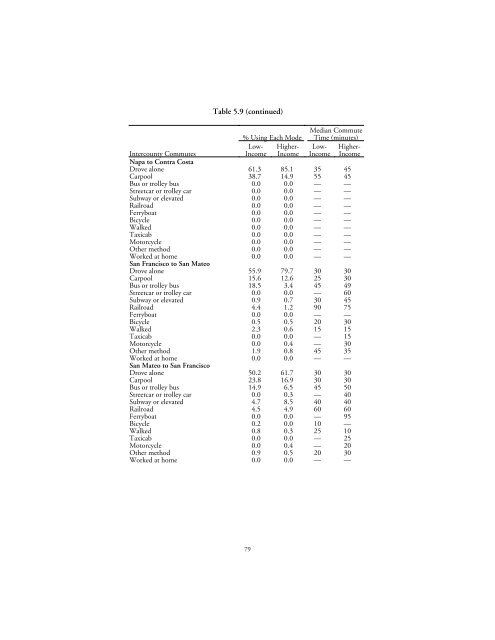
Table 5.9 (continued)<br />
% Using Each Mode<br />
<strong>Low</strong>- Higher-<br />
<strong>Income</strong> <strong>Income</strong><br />
Median Commute<br />
Time (minutes)<br />
<strong>Low</strong>- Higher-<br />
<strong>Income</strong> <strong>Income</strong><br />
Intercounty Commutes<br />
Napa to Contra Costa<br />
Drove alone 61.3 85.1 35 45<br />
Carpool 38.7 14.9 55 45<br />
Bus or trolley bus 0.0 0.0 — —<br />
Streetcar or trolley car 0.0 0.0 — —<br />
Subway or elevated 0.0 0.0 — —<br />
Railroad 0.0 0.0 — —<br />
Ferryboat 0.0 0.0 — —<br />
Bicycle 0.0 0.0 — —<br />
Walked 0.0 0.0 — —<br />
Taxicab 0.0 0.0 — —<br />
Motorcycle 0.0 0.0 — —<br />
Other method 0.0 0.0 — —<br />
Worked at home 0.0 0.0 — —<br />
San Francisco to San Mateo<br />
Drove alone 55.9 79.7 30 30<br />
Carpool 15.6 12.6 25 30<br />
Bus or trolley bus 18.5 3.4 45 49<br />
Streetcar or trolley car 0.0 0.0 — 60<br />
Subway or elevated 0.9 0.7 30 45<br />
Railroad 4.4 1.2 90 75<br />
Ferryboat 0.0 0.0 — —<br />
Bicycle 0.5 0.5 20 30<br />
Walked 2.3 0.6 15 15<br />
Taxicab 0.0 0.0 — 15<br />
Motorcycle 0.0 0.4 — 30<br />
Other method 1.9 0.8 45 35<br />
Worked at home 0.0 0.0 — —<br />
San Mateo to San Francisco<br />
Drove alone 50.2 61.7 30 30<br />
Carpool 23.8 16.9 30 30<br />
Bus or trolley bus 14.9 6.5 45 50<br />
Streetcar or trolley car 0.0 0.3 — 40<br />
Subway or elevated 4.7 8.5 40 40<br />
Railroad 4.5 4.9 60 60<br />
Ferryboat 0.0 0.0 — 95<br />
Bicycle 0.2 0.0 10 —<br />
Walked 0.8 0.3 25 10<br />
Taxicab 0.0 0.0 — 25<br />
Motorcycle 0.0 0.4 — 20<br />
Other method 0.9 0.5 20 30<br />
Worked at home 0.0 0.0 — —<br />
79


