- Page 1 and 2:
Transportation Spending by Low-Inco
- Page 3 and 4:
Foreword Mismatches between jobs an
- Page 5 and 6:
Summary Transportation is an import
- Page 7 and 8:
Table S.1 Median Annual Transportat
- Page 9 and 10:
about 5 to 10 percent of the median
- Page 11:
providing discounted transit fares
- Page 14 and 15:
5. COMMUTE BEHAVIOR IN THE BAY AREA
- Page 17:
Figures S.1. Vehicle Ownership and
- Page 20 and 21:
4.3. Costs of Illustrative Within-C
- Page 23 and 24:
1. Introduction Costs associated wi
- Page 25 and 26:
of “welfare-to-work” transporta
- Page 27:
lays out policy options for address
- Page 31 and 32:
2. Data and Methods In this report,
- Page 33 and 34:
advantage to this approach is that
- Page 35 and 36:
3. Transportation Expenditures in M
- Page 37 and 38:
Table 3.2 Vehicle Use, Vehicle Owne
- Page 39 and 40:
Components of Vehicle-Related Expen
- Page 41 and 42:
inspection, and auto club membershi
- Page 43 and 44:
income households and the higher-in
- Page 45 and 46:
eport looks primarily at cost and n
- Page 47 and 48:
The results from Table 3.5 indicate
- Page 49 and 50:
variation in transportation costs w
- Page 51 and 52:
overall household expenditures for
- Page 53 and 54:
31 Table 3.9 Transportation Expendi
- Page 55 and 56:
Table 3.10 Comparison of California
- Page 57 and 58:
Table 3.11 Comparison of the San Fr
- Page 59 and 60:
Table 3.10 have lower expenditure f
- Page 61 and 62:
4. Costs of Illustrative Bay Area C
- Page 63 and 64:
0-300 301-600 601-1100 1101-6813 Ba
- Page 65 and 66:
Table 4.2 Place of Work Comparison
- Page 67 and 68:
Concord CONTRA COSTA SAN FRANCISCO
- Page 69 and 70:
Administration (FHWA) mileage rate
- Page 71 and 72:
49 Table 4.3 Costs of Illustrative
- Page 73 and 74:
participants who took transit or ca
- Page 75 and 76:
Table 4.4 Costs of Illustrative Wit
- Page 77 and 78:
55 Table 4.5 Costs of Illustrative
- Page 79 and 80:
57 Table 4.6 Costs of Illustrative
- Page 81 and 82:
commutes is $4,240, whereas the hig
- Page 83 and 84:
The results from this chapter seem
- Page 85 and 86:
5. Commute Behavior in the Bay Area
- Page 87 and 88:
We also looked at mode choice using
- Page 89 and 90:
longer for higher-income workers if
- Page 91 and 92:
Table 5.3 (continued) Low- Income H
- Page 93 and 94:
Table 5.5 depicts the share of the
- Page 95 and 96:
73 Table 5.6 Mode Choice and Vehicl
- Page 97 and 98:
75 Table 5.8 Mode Choice and Vehicl
- Page 99 and 100:
households report having access to
- Page 101 and 102:
Table 5.9 (continued) % Using Each
- Page 103 and 104:
• Marin to San Francisco: As with
- Page 105 and 106:
Table 5.10 Median Commute Durations
- Page 107 and 108:
85 Table 5.11 Differences in Mode C
- Page 109 and 110:
Table 5.13 Mode Choice, Work Schedu
- Page 111:
trips, make more household-supporti
- Page 114 and 115:
only expenditures. Paying a given n
- Page 116 and 117:
improving service quality rather th
- Page 119:
Part II Policy Strategies and Areas
- Page 122 and 123: potential social costs such as poll
- Page 124 and 125: • Increasing income directly, to
- Page 126 and 127: grants for developments that meet c
- Page 128 and 129: make it easier for various entities
- Page 130 and 131: pass.” 10 Perhaps discounts could
- Page 132 and 133: free transit is most likely not app
- Page 134 and 135: have fares based on the time of day
- Page 136 and 137: hours for late night and graveyard
- Page 138 and 139: credit ratings, assisting with insu
- Page 140 and 141: would have paid with traditional au
- Page 142 and 143: citizens. Rather, the question shou
- Page 144 and 145: Facilitating Bicycling or Walking A
- Page 146 and 147: transportation hubs may be another
- Page 148 and 149: allowing flexibility at the local l
- Page 150 and 151: services, health care, drug treatme
- Page 152 and 153: costs. Efforts to incorporate infor
- Page 154 and 155: are differences) and by looking at
- Page 156 and 157: Dataset Poor Low-Income Higher-Inco
- Page 158 and 159: income, problems common to most hou
- Page 160 and 161: or the Bay Area specifically. We us
- Page 163 and 164: Appendix B Information on Specific
- Page 165 and 166: We also excluded expenditures on bi
- Page 167 and 168: Atlanta: Atlanta, GA MSA Miami: Mia
- Page 169 and 170: 147 Table B.1 (continued) CES Metro
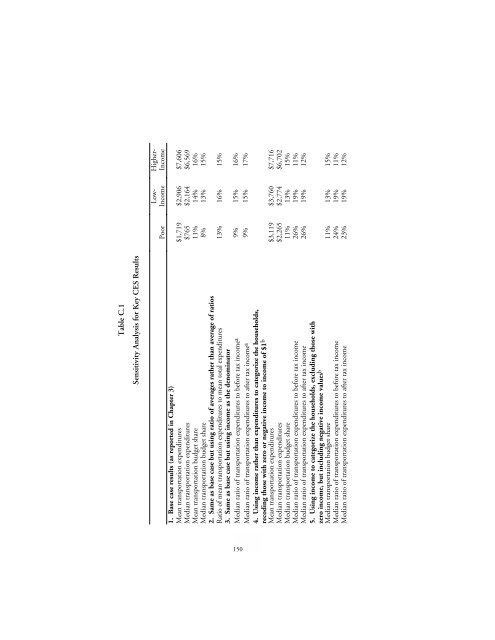
- Page 171: Appendix C Sensitivity Analysis for
- Page 175 and 176: transportation expenditures constit
- Page 177 and 178: Appendix D Methods Used for the Exa
- Page 179 and 180: Bibliography American Automobile As
- Page 181 and 182: Implications of Welfare Reform for
- Page 183 and 184: Lucas, M., and C. Nicholson, “Sub
- Page 185 and 186: Progressive Casualty Insurance Comp
- Page 187: About the Author LORIEN RICE Lorien


