

Transportation Spending by Low-Income California Households ...
Transportation Spending by Low-Income California Households ...
Transportation Spending by Low-Income California Households ...

Create successful ePaper yourself
Turn your PDF publications into a flip-book with our unique Google optimized e-Paper software.
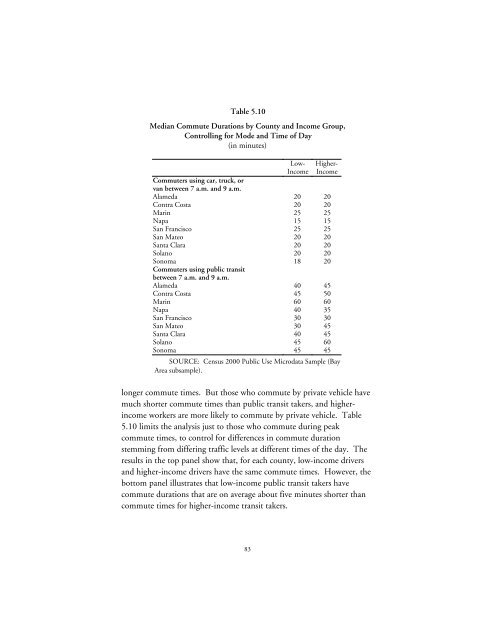
Table 5.10<br />
Median Commute Durations <strong>by</strong> County and <strong>Income</strong> Group,<br />
Controlling for Mode and Time of Day<br />
(in minutes)<br />
<strong>Low</strong>-<br />
<strong>Income</strong><br />
Higher-<br />
<strong>Income</strong><br />
Commuters using car, truck, or<br />
van between 7 a.m. and 9 a.m.<br />
Alameda 20 20<br />
Contra Costa 20 20<br />
Marin 25 25<br />
Napa 15 15<br />
San Francisco 25 25<br />
San Mateo 20 20<br />
Santa Clara 20 20<br />
Solano 20 20<br />
Sonoma 18 20<br />
Commuters using public transit<br />
between 7 a.m. and 9 a.m.<br />
Alameda 40 45<br />
Contra Costa 45 50<br />
Marin 60 60<br />
Napa 40 35<br />
San Francisco 30 30<br />
San Mateo 30 45<br />
Santa Clara 40 45<br />
Solano 45 60<br />
Sonoma 45 45<br />
SOURCE: Census 2000 Public Use Microdata Sample (Bay<br />
Area subsample).<br />
longer commute times. But those who commute <strong>by</strong> private vehicle have<br />
much shorter commute times than public transit takers, and higherincome<br />
workers are more likely to commute <strong>by</strong> private vehicle. Table<br />
5.10 limits the analysis just to those who commute during peak<br />
commute times, to control for differences in commute duration<br />
stemming from differing traffic levels at different times of the day. The<br />
results in the top panel show that, for each county, low-income drivers<br />
and higher-income drivers have the same commute times. However, the<br />
bottom panel illustrates that low-income public transit takers have<br />
commute durations that are on average about five minutes shorter than<br />
commute times for higher-income transit takers.<br />
83


