

Transportation Spending by Low-Income California Households ...
Transportation Spending by Low-Income California Households ...
Transportation Spending by Low-Income California Households ...

Create successful ePaper yourself
Turn your PDF publications into a flip-book with our unique Google optimized e-Paper software.
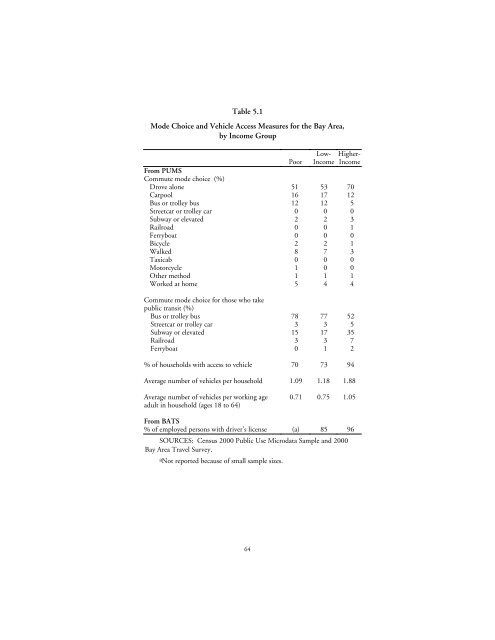
Table 5.1<br />
Mode Choice and Vehicle Access Measures for the Bay Area,<br />
<strong>by</strong> <strong>Income</strong> Group<br />
<strong>Low</strong>-<br />
<strong>Income</strong><br />
Higher-<br />
<strong>Income</strong><br />
Poor<br />
From PUMS<br />
Commute mode choice (%)<br />
Drove alone 51 53 70<br />
Carpool 16 17 12<br />
Bus or trolley bus 12 12 5<br />
Streetcar or trolley car 0 0 0<br />
Subway or elevated 2 2 3<br />
Railroad 0 0 1<br />
Ferryboat 0 0 0<br />
Bicycle 2 2 1<br />
Walked 8 7 3<br />
Taxicab 0 0 0<br />
Motorcycle 1 0 0<br />
Other method 1 1 1<br />
Worked at home 5 4 4<br />
Commute mode choice for those who take<br />
public transit (%)<br />
Bus or trolley bus 78 77 52<br />
Streetcar or trolley car 3 3 5<br />
Subway or elevated 15 17 35<br />
Railroad 3 3 7<br />
Ferryboat 0 1 2<br />
% of households with access to vehicle 70 73 94<br />
Average number of vehicles per household 1.09 1.18 1.88<br />
Average number of vehicles per working age<br />
adult in household (ages 18 to 64)<br />
0.71 0.75 1.05<br />
From BATS<br />
% of employed persons with driver’s license (a) 85 96<br />
SOURCES: Census 2000 Public Use Microdata Sample and 2000<br />
Bay Area Travel Survey.<br />
aNot reported because of small sample sizes.<br />
64


