

Transportation Spending by Low-Income California Households ...
Transportation Spending by Low-Income California Households ...
Transportation Spending by Low-Income California Households ...

Create successful ePaper yourself
Turn your PDF publications into a flip-book with our unique Google optimized e-Paper software.
a.m. and 9 a.m. However, controlling for time of day, low-income<br />
workers still appear to have shorter commutes.<br />
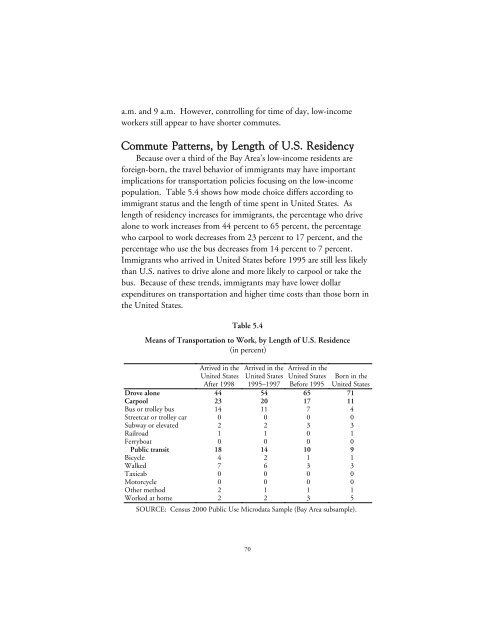
Commute Patterns, <strong>by</strong> Length of U.S. Residency<br />
Because over a third of the Bay Area’s low-income residents are<br />
foreign-born, the travel behavior of immigrants may have important<br />
implications for transportation policies focusing on the low-income<br />
population. Table 5.4 shows how mode choice differs according to<br />
immigrant status and the length of time spent in United States. As<br />
length of residency increases for immigrants, the percentage who drive<br />
alone to work increases from 44 percent to 65 percent, the percentage<br />
who carpool to work decreases from 23 percent to 17 percent, and the<br />
percentage who use the bus decreases from 14 percent to 7 percent.<br />
Immigrants who arrived in United States before 1995 are still less likely<br />
than U.S. natives to drive alone and more likely to carpool or take the<br />
bus. Because of these trends, immigrants may have lower dollar<br />
expenditures on transportation and higher time costs than those born in<br />
the United States.<br />
Table 5.4<br />
Means of <strong>Transportation</strong> to Work, <strong>by</strong> Length of U.S. Residence<br />
(in percent)<br />
Arrived in the<br />
United States<br />
After 1998<br />
Arrived in the<br />
United States<br />
1995–1997<br />
Arrived in the<br />
United States<br />
Before 1995<br />
Born in the<br />
United States<br />
Drove alone 44 54 65 71<br />
Carpool 23 20 17 11<br />
Bus or trolley bus 14 11 7 4<br />
Streetcar or trolley car 0 0 0 0<br />
Subway or elevated 2 2 3 3<br />
Railroad 1 1 0 1<br />
Ferryboat 0 0 0 0<br />
Public transit 18 14 10 9<br />
Bicycle 4 2 1 1<br />
Walked 7 6 3 3<br />
Taxicab 0 0 0 0<br />
Motorcycle 0 0 0 0<br />
Other method 2 1 1 1<br />
Worked at home 2 2 3 5<br />
SOURCE: Census 2000 Public Use Microdata Sample (Bay Area subsample).<br />
70


