

Transportation Spending by Low-Income California Households ...
Transportation Spending by Low-Income California Households ...
Transportation Spending by Low-Income California Households ...

You also want an ePaper? Increase the reach of your titles
YUMPU automatically turns print PDFs into web optimized ePapers that Google loves.
expenditures to the poverty threshold, and we calculated the 11th and<br />
27th percentiles of that distribution, which were 1.15168 and 1.75536,<br />
respectively. We classified households with an expenditure-to-povertythreshold<br />
ratio less than 1.15168 as poor, those with a ratio below<br />
1.75536 as low-income, and those with a ratio at or above 1.75536 as<br />
higher-income.<br />
Appendix C contains a sensitivity analysis that demonstrates how the<br />
results change under several different treatments of the data.<br />
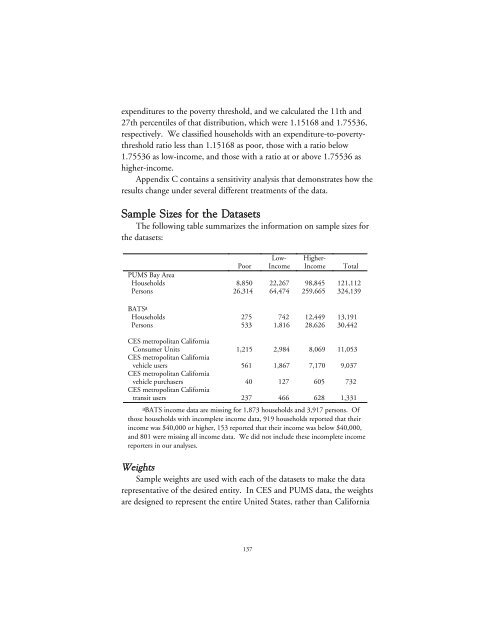
Sample Sizes for the Datasets<br />
The following table summarizes the information on sample sizes for<br />
the datasets:<br />
<strong>Low</strong>-<br />
<strong>Income</strong><br />
Higher-<br />
<strong>Income</strong><br />
Poor<br />
Total<br />
PUMS Bay Area<br />
<strong>Households</strong> 8,850 22,267 98,845 121,112<br />
Persons 26,314 64,474 259,665 324,139<br />
BATSa<br />
<strong>Households</strong> 275 742 12,449 13,191<br />
Persons 533 1,816 28,626 30,442<br />
CES metropolitan <strong>California</strong><br />
Consumer Units 1,215 2,984 8,069 11,053<br />
CES metropolitan <strong>California</strong><br />
vehicle users 561 1,867 7,170 9,037<br />
CES metropolitan <strong>California</strong><br />
vehicle purchasers 40 127 605 732<br />
CES metropolitan <strong>California</strong><br />
transit users 237 466 628 1,331<br />
aBATS income data are missing for 1,873 households and 3,917 persons. Of<br />
those households with incomplete income data, 919 households reported that their<br />
income was $40,000 or higher, 153 reported that their income was below $40,000,<br />
and 801 were missing all income data. We did not include these incomplete income<br />
reporters in our analyses.<br />
Weights<br />
Sample weights are used with each of the datasets to make the data<br />
representative of the desired entity. In CES and PUMS data, the weights<br />
are designed to represent the entire United States, rather than <strong>California</strong><br />
137


