Transportation Spending by Low-Income California Households ...
Transportation Spending by Low-Income California Households ...
Transportation Spending by Low-Income California Households ...
Create successful ePaper yourself
Turn your PDF publications into a flip-book with our unique Google optimized e-Paper software.
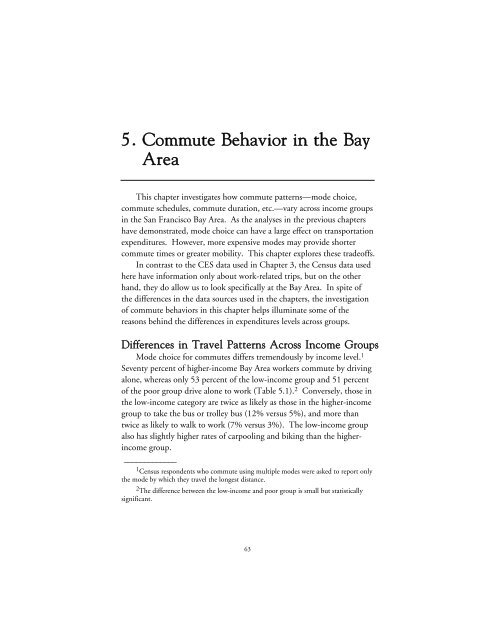
5. Commute Behavior in the Bay<br />
Area<br />
This chapter investigates how commute patterns—mode choice,<br />
commute schedules, commute duration, etc.—vary across income groups<br />
in the San Francisco Bay Area. As the analyses in the previous chapters<br />
have demonstrated, mode choice can have a large effect on transportation<br />
expenditures. However, more expensive modes may provide shorter<br />
commute times or greater mobility. This chapter explores these tradeoffs.<br />
In contrast to the CES data used in Chapter 3, the Census data used<br />
here have information only about work-related trips, but on the other<br />
hand, they do allow us to look specifically at the Bay Area. In spite of<br />
the differences in the data sources used in the chapters, the investigation<br />
of commute behaviors in this chapter helps illuminate some of the<br />
reasons behind the differences in expenditures levels across groups.<br />
Differences in Travel Patterns Across <strong>Income</strong> Groups<br />
Mode choice for commutes differs tremendously <strong>by</strong> income level. 1<br />
Seventy percent of higher-income Bay Area workers commute <strong>by</strong> driving<br />
alone, whereas only 53 percent of the low-income group and 51 percent<br />
of the poor group drive alone to work (Table 5.1). 2 Conversely, those in<br />
the low-income category are twice as likely as those in the higher-income<br />
group to take the bus or trolley bus (12% versus 5%), and more than<br />
twice as likely to walk to work (7% versus 3%). The low-income group<br />
also has slightly higher rates of carpooling and biking than the higherincome<br />
group.<br />
_____________<br />
1 Census respondents who commute using multiple modes were asked to report only<br />
the mode <strong>by</strong> which they travel the longest distance.<br />
2 The difference between the low-income and poor group is small but statistically<br />
significant.<br />
63


