

Transportation Spending by Low-Income California Households ...
Transportation Spending by Low-Income California Households ...
Transportation Spending by Low-Income California Households ...

You also want an ePaper? Increase the reach of your titles
YUMPU automatically turns print PDFs into web optimized ePapers that Google loves.
75<br />
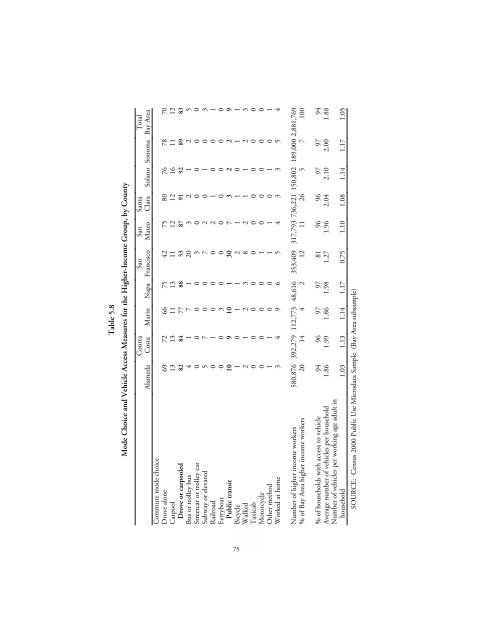
Table 5.8<br />
Mode Choice and Vehicle Access Measures for the Higher-<strong>Income</strong> Group, <strong>by</strong> County<br />
Alameda<br />
Contra<br />
Costa Marin Napa<br />
San<br />
Francisco<br />
San<br />
Mateo<br />
Santa<br />
Clara Solano Sonoma<br />
Total<br />
Bay Area<br />
Commute mode choice<br />
Drove alone 69 72 66 75 42 75 80 76 78 70<br />
Carpool 13 13 11 13 11 12 12 16 11 12<br />
Drove or carpooled 82 84 77 88 53 87 91 92 89 83<br />
Bus or trolley bus 4 1 7 1 20 3 2 1 2 5<br />
Streetcar or trolley car 0 0 0 0 3 0 0 0 0 0<br />
Subway or elevated 5 7 0 0 7 2 0 1 0 3<br />
Railroad 0 1 0 0 0 2 1 0 0 1<br />
Ferryboat 0 0 3 0 0 0 0 0 0 0<br />
Public transit 10 9 10 1 30 7 3 2 2 9<br />
Bicycle 1 0 1 1 2 1 1 0 1 1<br />
Walked 2 1 2 3 8 2 1 1 2 3<br />
Taxicab 0 0 0 0 0 0 0 0 0 0<br />
Motorcycle 0 0 0 0 1 0 0 0 0 0<br />
Other method 1 1 0 0 1 1 0 1 0 1<br />
Worked at home 3 4 9 6 5 4 3 3 5 4<br />
Number of higher income workers 580,876 392,279 112,773 48,616 353,409 317,793 736,221 150,802 189,000 2,881,769<br />
% of Bay Area higher income workers 20 14 4 2 12 11 26 5 7 100<br />
% of households with access to vehicle 94 96 97 97 81 96 96 97 97 94<br />
Average number of vehicles per household 1.86 1.99 1.86 1.98 1.27 1.96 2.04 2.10 2.00 1.88<br />
Number of vehicles per working age adult in<br />
household 1.03 1.13 1.14 1.17 0.75 1.10 1.08 1.14 1.17 1.05<br />
SOURCE: Census 2000 Public Use Microdata Sample (Bay Area subsample)


