

Transportation Spending by Low-Income California Households ...
Transportation Spending by Low-Income California Households ...
Transportation Spending by Low-Income California Households ...

Create successful ePaper yourself
Turn your PDF publications into a flip-book with our unique Google optimized e-Paper software.
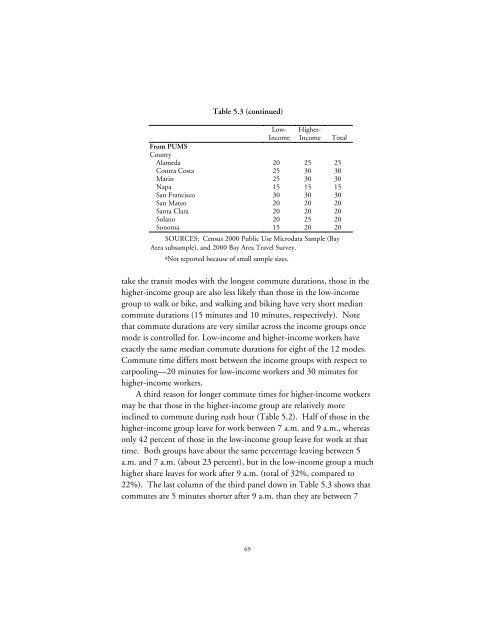
Table 5.3 (continued)<br />
<strong>Low</strong>-<br />
<strong>Income</strong><br />
Higher-<br />
<strong>Income</strong><br />
Total<br />
From PUMS<br />
County<br />
Alameda 20 25 25<br />
Contra Costa 25 30 30<br />
Marin 25 30 30<br />
Napa 15 15 15<br />
San Francisco 30 30 30<br />
San Mateo 20 20 20<br />
Santa Clara 20 20 20<br />
Solano 20 25 20<br />
Sonoma 15 20 20<br />
SOURCES: Census 2000 Public Use Microdata Sample (Bay<br />
Area subsample), and 2000 Bay Area Travel Survey.<br />
aNot reported because of small sample sizes.<br />
take the transit modes with the longest commute durations, those in the<br />
higher-income group are also less likely than those in the low-income<br />
group to walk or bike, and walking and biking have very short median<br />
commute durations (15 minutes and 10 minutes, respectively). Note<br />
that commute durations are very similar across the income groups once<br />
mode is controlled for. <strong>Low</strong>-income and higher-income workers have<br />
exactly the same median commute durations for eight of the 12 modes.<br />
Commute time differs most between the income groups with respect to<br />
carpooling—20 minutes for low-income workers and 30 minutes for<br />
higher-income workers.<br />
A third reason for longer commute times for higher-income workers<br />
may be that those in the higher-income group are relatively more<br />
inclined to commute during rush hour (Table 5.2). Half of those in the<br />
higher-income group leave for work between 7 a.m. and 9 a.m., whereas<br />
only 42 percent of those in the low-income group leave for work at that<br />
time. Both groups have about the same percentage leaving between 5<br />
a.m. and 7 a.m. (about 23 percent), but in the low-income group a much<br />
higher share leaves for work after 9 a.m. (total of 32%, compared to<br />
22%). The last column of the third panel down in Table 5.3 shows that<br />
commutes are 5 minutes shorter after 9 a.m. than they are between 7<br />
69


