

Transportation Spending by Low-Income California Households ...
Transportation Spending by Low-Income California Households ...
Transportation Spending by Low-Income California Households ...

You also want an ePaper? Increase the reach of your titles
YUMPU automatically turns print PDFs into web optimized ePapers that Google loves.
151<br />
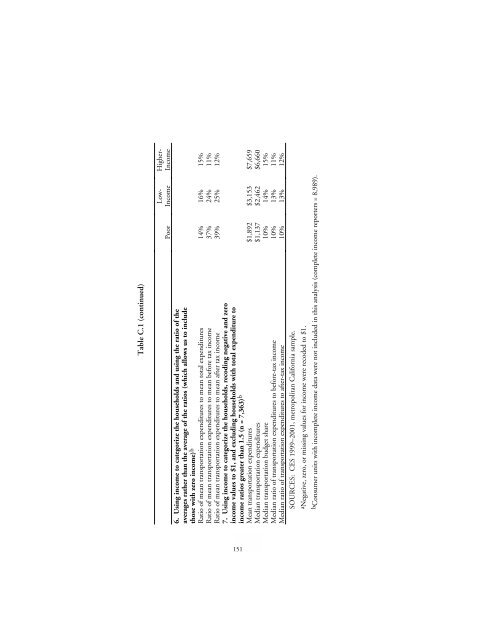
Table C.1 (continued)<br />
Poor<br />
<strong>Low</strong>-<br />
<strong>Income</strong><br />
Higher-<br />
<strong>Income</strong><br />
those with zero income)b<br />
Ratio of mean transportation expenditures to mean total expenditures 14% 16% 15%<br />
Ratio of mean transportation expenditures to mean before tax income 37% 24% 11%<br />
Ratio of mean transportation expenditures to mean after tax income 39% 25% 12%<br />
7. Using income to categorize the households, recoding negative and zero<br />
income values to $1, and excluding households with total expenditure to<br />
income ratios greater than 1.5 (n = 7,363)b<br />
Mean transportation expenditures $1,892 $3,153 $7,659<br />
Median transportation expenditures $1,137 $2,462 $6,660<br />
Median transportation budget share 10% 14% 15%<br />
Median ratio of transportation expenditures to before-tax income 10% 13% 11%<br />
Median ratio of transportation expenditures to after-tax income 10% 13% 12%<br />
SOURCES: CES 1999–2001, metropolitan <strong>California</strong> sample.<br />
aNegative, zero, or missing values for income were recoded to $1.<br />
averages rather than the average of the ratios (which allows us to include<br />
6. Using income to categorize the households and using the ratio of the<br />
bConsumer units with incomplete income data were not included in this analysis (complete income reporters = 8,989).


