

Transportation Spending by Low-Income California Households ...
Transportation Spending by Low-Income California Households ...
Transportation Spending by Low-Income California Households ...

Create successful ePaper yourself
Turn your PDF publications into a flip-book with our unique Google optimized e-Paper software.
49<br />
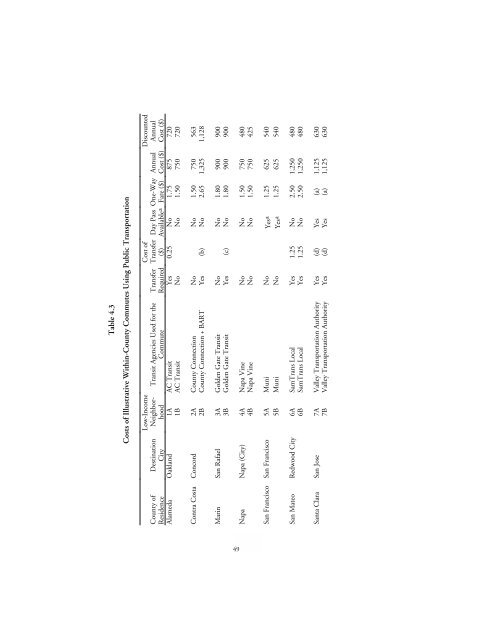
Table 4.3<br />
Costs of Illustrative Within-County Commutes Using Public <strong>Transportation</strong><br />
County of<br />
Residence<br />
Destination<br />
City<br />
<strong>Low</strong>-<strong>Income</strong><br />
Neighborhood<br />
Transit Agencies Used for the<br />
Commute<br />
Transfer<br />
Required<br />
Cost of<br />
Transfer<br />
($)<br />
Day Pass One-Way<br />
Availablea Fare ($)<br />
Cost ($) Annual Cost ($)<br />
Annual<br />
Discounted<br />
Alameda Oakland 1A AC Transit Yes 0.25 No 1.75 875 720<br />
1B AC Transit No No 1.50 750 720<br />
Contra Costa Concord 2A County Connection No No 1.50 750 563<br />
2B County Connection + BART Yes (b) No 2.65 1,325 1,128<br />
Marin San Rafael 3A Golden Gate Transit No No 1.80 900 900<br />
3B Golden Gate Transit Yes (c) No 1.80 900 900<br />
Napa Napa (City) 4A Napa Vine No No 1.50 750 480<br />
4B Napa Vine No No 1.50 750 425<br />
San Francisco San Francisco 5A Muni No Yesa 1.25 625 540<br />
5B Muni No Yesa 1.25 625 540<br />
San Mateo Redwood City 6A SamTrans Local Yes 1.25 No 2.50 1,250 480<br />
6B SamTrans Local Yes 1.25 No 2.50 1,250 480<br />
Santa Clara San Jose 7A Valley <strong>Transportation</strong> Authority Yes (d) Yes (a) 1,125 630<br />
7B Valley <strong>Transportation</strong> Authority Yes (d) Yes (a) 1,125 630


