

Transportation Spending by Low-Income California Households ...
Transportation Spending by Low-Income California Households ...
Transportation Spending by Low-Income California Households ...

You also want an ePaper? Increase the reach of your titles
YUMPU automatically turns print PDFs into web optimized ePapers that Google loves.
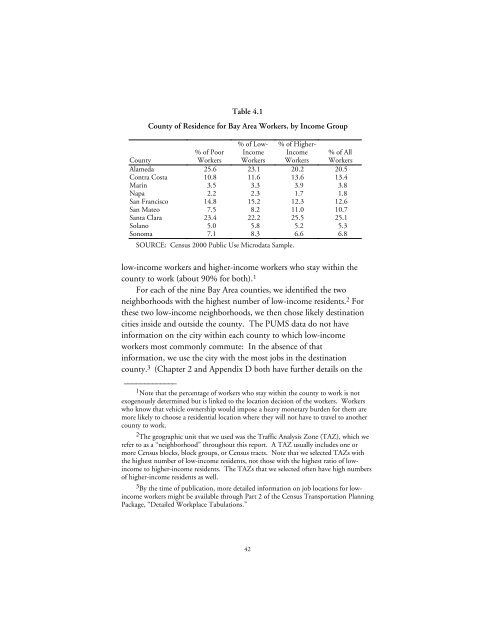
Table 4.1<br />
County of Residence for Bay Area Workers, <strong>by</strong> <strong>Income</strong> Group<br />
% of <strong>Low</strong>-<br />
<strong>Income</strong><br />
Workers<br />
% of Higher-<br />
<strong>Income</strong><br />
Workers<br />
County<br />
% of Poor<br />
Workers<br />
% of All<br />
Workers<br />
Alameda 25.6 23.1 20.2 20.5<br />
Contra Costa 10.8 11.6 13.6 13.4<br />
Marin 3.5 3.3 3.9 3.8<br />
Napa 2.2 2.3 1.7 1.8<br />
San Francisco 14.8 15.2 12.3 12.6<br />
San Mateo 7.5 8.2 11.0 10.7<br />
Santa Clara 23.4 22.2 25.5 25.1<br />
Solano 5.0 5.8 5.2 5.3<br />
Sonoma 7.1 8.3 6.6 6.8<br />
SOURCE: Census 2000 Public Use Microdata Sample.<br />
low-income workers and higher-income workers who stay within the<br />
county to work (about 90% for both). 1<br />
For each of the nine Bay Area counties, we identified the two<br />
neighborhoods with the highest number of low-income residents. 2 For<br />
these two low-income neighborhoods, we then chose likely destination<br />
cities inside and outside the county. The PUMS data do not have<br />
information on the city within each county to which low-income<br />
workers most commonly commute: In the absence of that<br />
information, we use the city with the most jobs in the destination<br />
county. 3 (Chapter 2 and Appendix D both have further details on the<br />
_____________<br />
1 Note that the percentage of workers who stay within the county to work is not<br />
exogenously determined but is linked to the location decision of the workers. Workers<br />
who know that vehicle ownership would impose a heavy monetary burden for them are<br />
more likely to choose a residential location where they will not have to travel to another<br />
county to work.<br />
2 The geographic unit that we used was the Traffic Analysis Zone (TAZ), which we<br />
refer to as a “neighborhood” throughout this report. A TAZ usually includes one or<br />
more Census blocks, block groups, or Census tracts. Note that we selected TAZs with<br />
the highest number of low-income residents, not those with the highest ratio of lowincome<br />
to higher-income residents. The TAZs that we selected often have high numbers<br />
of higher-income residents as well.<br />
3 By the time of publication, more detailed information on job locations for lowincome<br />
workers might be available through Part 2 of the Census <strong>Transportation</strong> Planning<br />
Package, “Detailed Workplace Tabulations.”<br />
42


