

Transportation Spending by Low-Income California Households ...
Transportation Spending by Low-Income California Households ...
Transportation Spending by Low-Income California Households ...

You also want an ePaper? Increase the reach of your titles
YUMPU automatically turns print PDFs into web optimized ePapers that Google loves.
31<br />
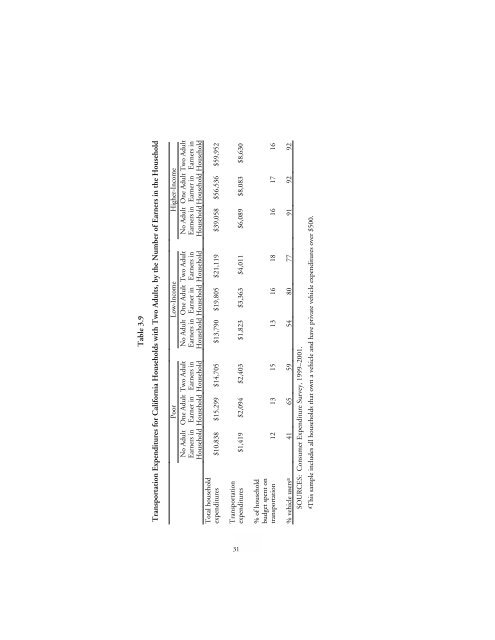
Table 3.9<br />
<strong>Transportation</strong> Expenditures for <strong>California</strong> <strong>Households</strong> with Two Adults, <strong>by</strong> the Number of Earners in the Household<br />
Poor <strong>Low</strong>-<strong>Income</strong> Higher-<strong>Income</strong><br />
Household Earners in No Adult Household Earner in One Adult Household<br />
Earners in<br />
Two Adult<br />
Household Earners in No Adult Household Earner in One Adult Household<br />
Earners in<br />
Two Adult<br />
No Adult<br />
Earners in<br />
Household<br />
Household Earner in One Adult Household<br />
Earners in<br />
Two Adult<br />
Total household<br />
expenditures $10,838 $15,299 $14,705 $13,790 $19,805 $21,119 $39,058 $56,536 $59,952<br />
<strong>Transportation</strong><br />
expenditures $1,419 $2,094 $2,403 $1,823 $3,363 $4,011 $6,089 $8,083 $8,630<br />
% of household<br />
budget spent on<br />
transportation 12 13 15 13 16 18 16 17 16<br />
% vehicle usersa 41 65 59 54 80 77 91 92 92<br />
SOURCES: Consumer Expenditure Survey, 1999–2001.<br />
aThis sample includes all households that own a vehicle and have private vehicle expenditures over $500.


