Transportation Spending by Low-Income California Households ...
Transportation Spending by Low-Income California Households ...
Transportation Spending by Low-Income California Households ...
You also want an ePaper? Increase the reach of your titles
YUMPU automatically turns print PDFs into web optimized ePapers that Google loves.
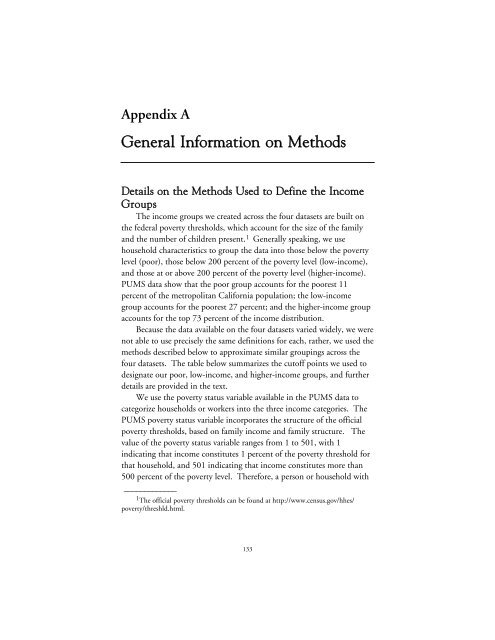
Appendix A<br />
General Information on Methods<br />
Details on the Methods Used to Define the <strong>Income</strong><br />
Groups<br />
The income groups we created across the four datasets are built on<br />
the federal poverty thresholds, which account for the size of the family<br />
and the number of children present. 1 Generally speaking, we use<br />
household characteristics to group the data into those below the poverty<br />
level (poor), those below 200 percent of the poverty level (low-income),<br />
and those at or above 200 percent of the poverty level (higher-income).<br />
PUMS data show that the poor group accounts for the poorest 11<br />
percent of the metropolitan <strong>California</strong> population; the low-income<br />
group accounts for the poorest 27 percent; and the higher-income group<br />
accounts for the top 73 percent of the income distribution.<br />
Because the data available on the four datasets varied widely, we were<br />
not able to use precisely the same definitions for each, rather, we used the<br />
methods described below to approximate similar groupings across the<br />
four datasets. The table below summarizes the cutoff points we used to<br />
designate our poor, low-income, and higher-income groups, and further<br />
details are provided in the text.<br />
We use the poverty status variable available in the PUMS data to<br />
categorize households or workers into the three income categories. The<br />
PUMS poverty status variable incorporates the structure of the official<br />
poverty thresholds, based on family income and family structure. The<br />
value of the poverty status variable ranges from 1 to 501, with 1<br />
indicating that income constitutes 1 percent of the poverty threshold for<br />
that household, and 501 indicating that income constitutes more than<br />
500 percent of the poverty level. Therefore, a person or household with<br />
_____________<br />
1 The official poverty thresholds can be found at http://www.census.gov/hhes/<br />
poverty/threshld.html.<br />
133


