Transportation Spending by Low-Income California Households ...
Transportation Spending by Low-Income California Households ...
Transportation Spending by Low-Income California Households ...
You also want an ePaper? Increase the reach of your titles
YUMPU automatically turns print PDFs into web optimized ePapers that Google loves.
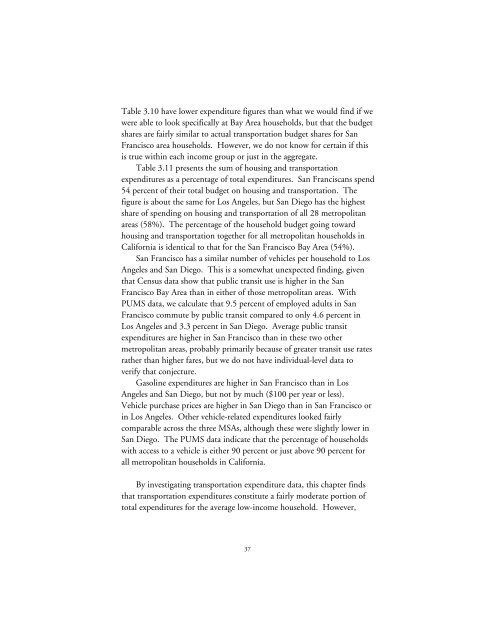
Table 3.10 have lower expenditure figures than what we would find if we<br />
were able to look specifically at Bay Area households, but that the budget<br />
shares are fairly similar to actual transportation budget shares for San<br />
Francisco area households. However, we do not know for certain if this<br />
is true within each income group or just in the aggregate.<br />
Table 3.11 presents the sum of housing and transportation<br />
expenditures as a percentage of total expenditures. San Franciscans spend<br />
54 percent of their total budget on housing and transportation. The<br />
figure is about the same for Los Angeles, but San Diego has the highest<br />
share of spending on housing and transportation of all 28 metropolitan<br />
areas (58%). The percentage of the household budget going toward<br />
housing and transportation together for all metropolitan households in<br />
<strong>California</strong> is identical to that for the San Francisco Bay Area (54%).<br />
San Francisco has a similar number of vehicles per household to Los<br />
Angeles and San Diego. This is a somewhat unexpected finding, given<br />
that Census data show that public transit use is higher in the San<br />
Francisco Bay Area than in either of those metropolitan areas. With<br />
PUMS data, we calculate that 9.5 percent of employed adults in San<br />
Francisco commute <strong>by</strong> public transit compared to only 4.6 percent in<br />
Los Angeles and 3.3 percent in San Diego. Average public transit<br />
expenditures are higher in San Francisco than in these two other<br />
metropolitan areas, probably primarily because of greater transit use rates<br />
rather than higher fares, but we do not have individual-level data to<br />
verify that conjecture.<br />
Gasoline expenditures are higher in San Francisco than in Los<br />
Angeles and San Diego, but not <strong>by</strong> much ($100 per year or less).<br />
Vehicle purchase prices are higher in San Diego than in San Francisco or<br />
in Los Angeles. Other vehicle-related expenditures looked fairly<br />
comparable across the three MSAs, although these were slightly lower in<br />
San Diego. The PUMS data indicate that the percentage of households<br />
with access to a vehicle is either 90 percent or just above 90 percent for<br />
all metropolitan households in <strong>California</strong>.<br />
By investigating transportation expenditure data, this chapter finds<br />
that transportation expenditures constitute a fairly moderate portion of<br />
total expenditures for the average low-income household. However,<br />
37


