- Page 1 and 2:
Preface The expedition ARK XIX/3 wi
- Page 3 and 4:
B. 1 Cruise leg ARK XIX/3b: An intr
- Page 5 and 6:
The ARK XIX/3 expedition A. 1 Itine
- Page 7 and 8:
positioning and navigation of the "
- Page 9 and 10:
was followed to obtain video materi
- Page 11 and 12:
On Friday morning the 20 th of June
- Page 13 and 14:
Fig. A1-2: The working area of the
- Page 15 and 16:
"Polarstern" (actual air temperatur
- Page 17 and 18:
6000" was still at depth "Polarster
- Page 19 and 20:
aseline navigation antennae which a
- Page 21 and 22:
Fig. A1-3: Entire cruise track of R
- Page 23 and 24:
At end of the leg pressure rising b
- Page 25 and 26:
The temperatures during the cruise
- Page 27 and 28:
Most frequent wind direction was so
- Page 29 and 30:
A. 3.1 High resolution seabed mappi
- Page 31 and 32:
On the other hand, the accuracy of
- Page 33 and 34:
The sampling campaign was also unde
- Page 35 and 36:
Hydrosweep DS2 is installed onboard
- Page 37 and 38:
Fig. A4.2-2: Normalized backscatter
- Page 39 and 40:
In addition to the micro bathymetry
- Page 41 and 42:
ackscatter value of -37.0dB, -38.9d
- Page 43 and 44:
athymetry and angular backscatter d
- Page 45 and 46:
A. 4.3 Sedimentary and hydrodynamic
- Page 47 and 48:
glacial periods. There is also evid
- Page 49 and 50:
Fig. A4.3.2-2: Visualisation of dif
- Page 51 and 52:
It seems that all the mounds along
- Page 53 and 54:
Visible calcareous fauna removed (b
- Page 55 and 56:
Fig. A4.3.3-2 Location of SAMS Phot
- Page 57 and 58:
Box Core Sample Log Sheet Station N
- Page 59 and 60:
Box Core Sample Log Sheet Station N
- Page 61 and 62:
Box Core Sample Log Sheet Station N
- Page 63 and 64:
Box Core Sample Log Sheet Station N
- Page 65 and 66:
Box Core Sample Log Sheet Station N
- Page 67 and 68:
Box Core Sample Log Sheet Station N
- Page 69 and 70:
Box Core Sample Log Sheet Station N
- Page 71 and 72:
Box Core Sample Log Sheet Station N
- Page 73 and 74:
A. 4.3.4 Influence of mound topogra
- Page 75 and 76:
A. 4.3.5 Photo lander deployment on
- Page 77 and 78:
- UMI data logger controlling a tra
- Page 79 and 80:
Fig. A4.3.5-3. Close-up view of the
- Page 81 and 82:
Lineated features are present NE of
- Page 83 and 84:
CARACOLE Cruise Report 30/07/2001 (
- Page 85 and 86:
intermediate nepheloid layers (Dick
- Page 87 and 88:
Fig. A4.4.1-2. Location of main stu
- Page 89 and 90:
Box Core Sample Log Sheet Station N
- Page 91 and 92:
Box Core Sample Log Sheet Station N
- Page 93 and 94:
Box Core Sample Log Sheet Station N
- Page 95 and 96:
A. 4.4.3 Biogeoprocesses along the
- Page 97 and 98:
Box Core Sample Log Sheet Station N
- Page 99 and 100:
in the database with the exact posi
- Page 101 and 102:
The areas with significant benthic
- Page 103 and 104:
predators and strong bottom current
- Page 105 and 106:
faunal distribution. Palaentologica
- Page 107 and 108:
ocks predate the last glaciation, s
- Page 109 and 110:
Box Core Sample Log Sheet Station N
- Page 111 and 112:
Box Core Sample Log Sheet Station N
- Page 113 and 114:
Box Core Sample Log Sheet Station N
- Page 115 and 116:
Box Core Sample Log Sheet Station N
- Page 117 and 118:
Box Core Sample Log Sheet Station N
- Page 119 and 120: A. 4.4.6 Biological and geological
- Page 121 and 122: Hovland M, Croker PF, Martin M (199
- Page 123 and 124: Live fauna Sediments Live fauna and
- Page 125 and 126: sites can subsequently be transport
- Page 127 and 128: 4) The NSOW has similar water mass
- Page 129 and 130: 0 100 200 300 400 500 600 700 800 P
- Page 131 and 132: A. 4.8 Deep water coral ecology and
- Page 133 and 134: and video observations made. On ret
- Page 135 and 136: Fig. A4.8.2-2: This orange, planar
- Page 137 and 138: Fig. A4.8.2-4: Feather-shaped alcyo
- Page 139 and 140: Fig. A4.8.2-7: Top left) Yellow alc
- Page 141 and 142: scour or demersal trawling. The gro
- Page 143 and 144: survey at frequencies of 38, 70, 12
- Page 145 and 146: "Belgica mounds" - Porcupine Seabig
- Page 147 and 148: "Twin mounds" - Porcupine Bank 14°
- Page 149 and 150: corals were alive, relatively abund
- Page 151 and 152: Network Setup for Tests The setup f
- Page 153 and 154: are only initial testings and much
- Page 155 and 156: pressure produced as a consequence
- Page 157 and 158: surrounded by elevated sediment fea
- Page 159 and 160: B. 2 Microbathymetry on ROV "Victor
- Page 161 and 162: Pitch correction Due to assembling
- Page 163 and 164: Maps Complete area Håkon Mosby Mud
- Page 165 and 166: B. 3 Geochemistry, geophysics and s
- Page 167 and 168: Heat Flow HMMV 2m # # # # # # # # #
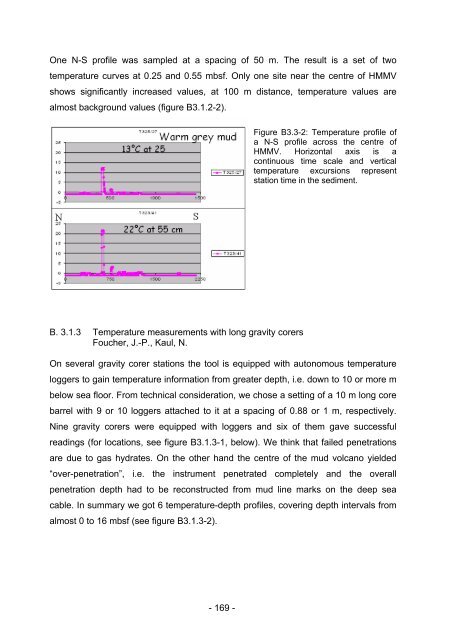
- Page 169: Lat_dec. Lon_dec Name k T_0m PS64/s
- Page 173 and 174: Table B3.2-1: Technical specificati
- Page 175 and 176: Sound velocity: As the cores all co
- Page 177 and 178: Fig. B3.3-1: Display of a 4 km long
- Page 179 and 180: sediment cores varies between 166 t
- Page 181 and 182: Fig. B3.4-1b: Lithological descript
- Page 183 and 184: Fig. B3.4-1d: Lithological descript
- Page 185 and 186: Fig. B3.4-1f: Lithological descript
- Page 187 and 188: hydrotroilite and gas hydrate, this
- Page 189 and 190: As an example, a echo sounder image
- Page 191 and 192: B. 5 Biological investigations at t
- Page 193 and 194: - How much methane is oxidized aero
- Page 195 and 196: profiler). Bottom water samples hav
- Page 197 and 198: the water column was measured using
- Page 199 and 200: 1 kg of tubeworms in wet weight. Th
- Page 201 and 202: B. 5.2 Microscale analysis of the s
- Page 203 and 204: Laboratory measurements Central sit
- Page 205 and 206: O2, CO3-- (mM) Beggiatoa mats, 30/0
- Page 207 and 208: Photograph of the sulfide oxidising
- Page 209 and 210: Central area No measurements could
- Page 211 and 212: the temperature profile showed adve
- Page 213 and 214: B. 5.3 Methane in gas hydrate beari
- Page 215 and 216: The deployments covered 3 (5) diffe
- Page 217 and 218: flows at the Håkon Mosby Mud Volca
- Page 219 and 220: The quality of the mosaics depends
- Page 221 and 222:
[2] Vincent AG, Pessel N, Borgetto
- Page 223 and 224:
### ( ) # ###### # ## # # # #### #
- Page 225 and 226:
References Milkov, A., Vogt, P., Ch
- Page 227 and 228:
ROV "Victor 6000" The ROV "Victor 6
- Page 229 and 230:
has spent in organising the coring
- Page 231 and 232:
A multiple corer was used to retrie
- Page 233 and 234:
At the position of the moorings a C
- Page 235 and 236:
Micro profiles of O 2 but also of p
- Page 237 and 238:
The current regime luff and lee sid
- Page 239 and 240:
2° 3° 4° N2 5° PS64/481 PS64/48
- Page 241 and 242:
station IRD archive liner bulk x-ra
- Page 243 and 244:
C. 4 Marine Geology Kukina, N. Majo
- Page 245 and 246:
2° 3° 4° 5° 6° PS64/481 79°20
- Page 247 and 248:
Appendix 1: List of samples for fut
- Page 249 and 250:
- 248 -
- Page 251 and 252:
- 250 -
- Page 253 and 254:
material via the Transpolar Drift t
- Page 255 and 256:
ounding processes as well. One poss
- Page 257 and 258:
The most frequent rock type is sand
- Page 259 and 260:
Eastern Greenland, Iceland and Scan
- Page 261 and 262:
C. 6 Debris on the seafloor at “H
- Page 263 and 264:
Results A summary of the results is
- Page 265 and 266:
enthic community are of crucial imp
- Page 267 and 268:
frame showed no obvious colonisatio
- Page 269 and 270:
subsamples (area of 400 - 800 cm 2
- Page 271 and 272:
using shipboard techniques - provid
- Page 273 and 274:
Tab C11-1: Stationlist of in situ m
- Page 275 and 276:
Tab. C11-2: In-situ measurements of
- Page 277 and 278:
Tab. C11-2: In-situ measurements of
- Page 279 and 280:
Climate models predict that global
- Page 281 and 282:
90 mean copepod densities/ 10 cm 2
- Page 283 and 284:
- Molecular phylogeny and phylogeog
- Page 285 and 286:
Species Stations Tmetonyx sp.1 326-
- Page 287 and 288:
was used to terminate and sample th
- Page 289 and 290:
openings of 45° at both sides the
- Page 291 and 292:
Station Date Time PositionLat Posit
- Page 293 and 294:
Station Date Time PositionLat Posit
- Page 295 and 296:
Station Date Time PositionLat Posit
- Page 297 and 298:
Station Date Time PositionLat Posit
- Page 299 and 300:
Station Date Time PositionLat Posit
- Page 301 and 302:
Station Date Time PositionLat Posit
- Page 303 and 304:
Station Date Time PositionLat Posit
- Page 305 and 306:
Station Date Time PositionLat Posit
- Page 307 and 308:
Station Date Time PositionLat Posit
- Page 309 and 310:
Station Date Time PositionLat Posit
- Page 311 and 312:
Station Date Time PositionLat Posit
- Page 313 and 314:
Station Date Time PositionLat Posit
- Page 315 and 316:
Station Date Time PositionLat Posit
- Page 317 and 318:
Station Date Time PositionLat Posit
- Page 319 and 320:
Station Date Time PositionLat Posit
- Page 321 and 322:
Station Date Time PositionLat Posit
- Page 323 and 324:
Station Date Time PositionLat Posit
- Page 325 and 326:
Station Date Time PositionLat Posit
- Page 327 and 328:
Station Date Time PositionLat Posit
- Page 329 and 330:
Station Date Time PositionLat Posit
- Page 331 and 332:
Station Date Time PositionLat Posit
- Page 333 and 334:
Station Date Time PositionLat Posit
- Page 335 and 336:
Station Date Time PositionLat Posit
- Page 337 and 338:
Station Date Time PositionLat Posit
- Page 339 and 340:
Station Date Time PositionLat Posit
- Page 341 and 342:
Station Date Time PositionLat Posit
- Page 343 and 344:
Station Date Time PositionLat Posit
- Page 345 and 346:
Station Date Time PositionLat Posit
- Page 347 and 348:
E. Participating institutes / compa
- Page 349 and 350:
Acronym Participants iSiTEC GmbH IS
- Page 351 and 352:
F. Participants F. 1 Participants A
- Page 353 and 354:
F. 2 Participants ARK XIX/3b Armand
- Page 355 and 356:
F. 3 Participants ARK XIX/3c Bauerf