Experimental Study of Biodegradation of Ethanol and Toluene Vapors
Experimental Study of Biodegradation of Ethanol and Toluene Vapors
Experimental Study of Biodegradation of Ethanol and Toluene Vapors
You also want an ePaper? Increase the reach of your titles
YUMPU automatically turns print PDFs into web optimized ePapers that Google loves.
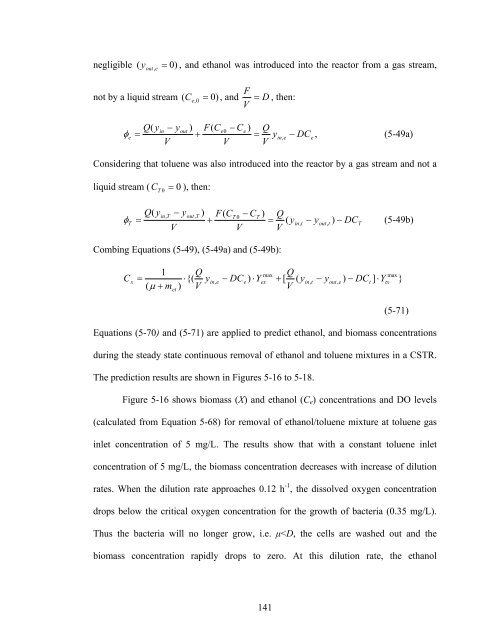
negligible<br />
( y out , e<br />
= 0)<br />
, <strong>and</strong> ethanol was introduced into the reactor from a gas stream,<br />
not by a liquid stream<br />
( C<br />
e, 0<br />
= 0) , <strong>and</strong> D<br />
V<br />
F = , then:<br />
e<br />
Q(<br />
yin<br />
− yout<br />
) F(<br />
Ce0 − Ce<br />
) Q<br />
φ<br />
e<br />
= +<br />
= yin,<br />
e<br />
− DC , (5-49a)<br />
V<br />
V V<br />
Considering that toluene was also introduced into the reactor by a gas stream <strong>and</strong> not a<br />
liquid stream ( C T 0<br />
= 0 ), then:<br />
Q(<br />
yin,<br />
T<br />
− yout,<br />
T<br />
) F(<br />
CT<br />
0<br />
− CT<br />
) Q<br />
φ<br />
T<br />
= +<br />
= ( yin,<br />
t<br />
− yout,<br />
t<br />
) − DCT<br />
(5-49b)<br />
V<br />
V V<br />
Combing Equations (5-49), (5-49a) <strong>and</strong> (5-49b):<br />
C<br />
x<br />
(<br />
1 Q<br />
max Q<br />
max<br />
= ⋅{(<br />
yin, e<br />
− DCe<br />
) ⋅Yex<br />
+ [ ( yin,<br />
t<br />
− yout,<br />
e<br />
) − DCt<br />
] ⋅Ytx<br />
}<br />
μ + met<br />
) V<br />
V<br />
(5-71)<br />
Equations (5-70) <strong>and</strong> (5-71) are applied to predict ethanol, <strong>and</strong> biomass concentrations<br />
during the steady state continuous removal <strong>of</strong> ethanol <strong>and</strong> toluene mixtures in a CSTR.<br />
The prediction results are shown in Figures 5-16 to 5-18.<br />
Figure 5-16 shows biomass (X) <strong>and</strong> ethanol (C e ) concentrations <strong>and</strong> DO levels<br />
(calculated from Equation 5-68) for removal <strong>of</strong> ethanol/toluene mixture at toluene gas<br />
inlet concentration <strong>of</strong> 5 mg/L. The results show that with a constant toluene inlet<br />
concentration <strong>of</strong> 5 mg/L, the biomass concentration decreases with increase <strong>of</strong> dilution<br />
rates. When the dilution rate approaches 0.12 h -1 , the dissolved oxygen concentration<br />
drops below the critical oxygen concentration for the growth <strong>of</strong> bacteria (0.35 mg/L).<br />
Thus the bacteria will no longer grow, i.e. μ


